Knack No-code Web Application
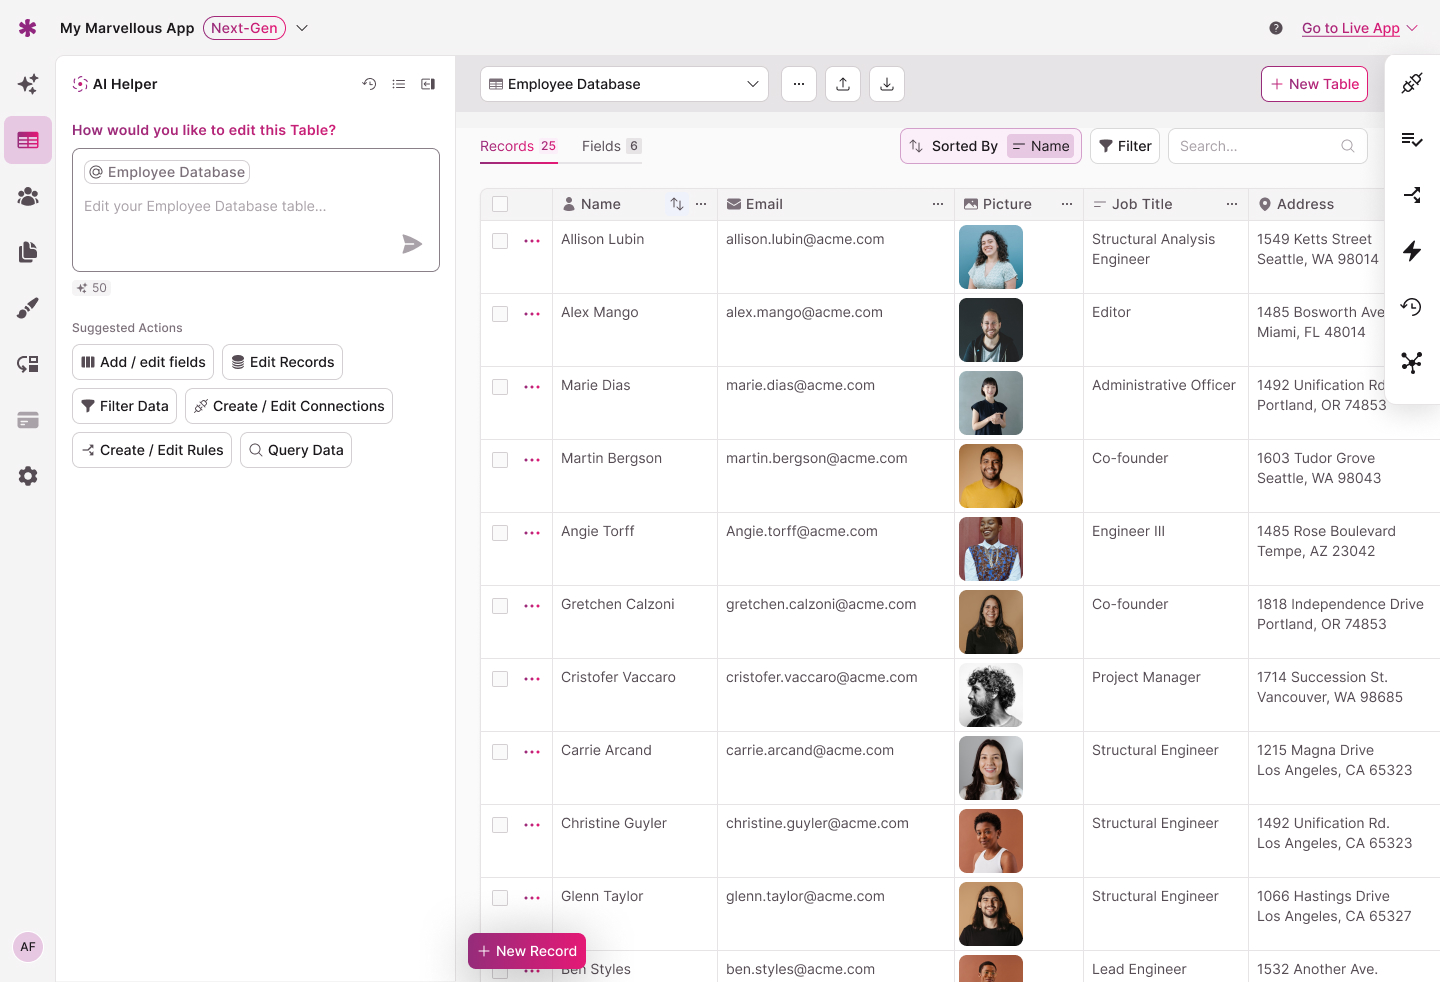
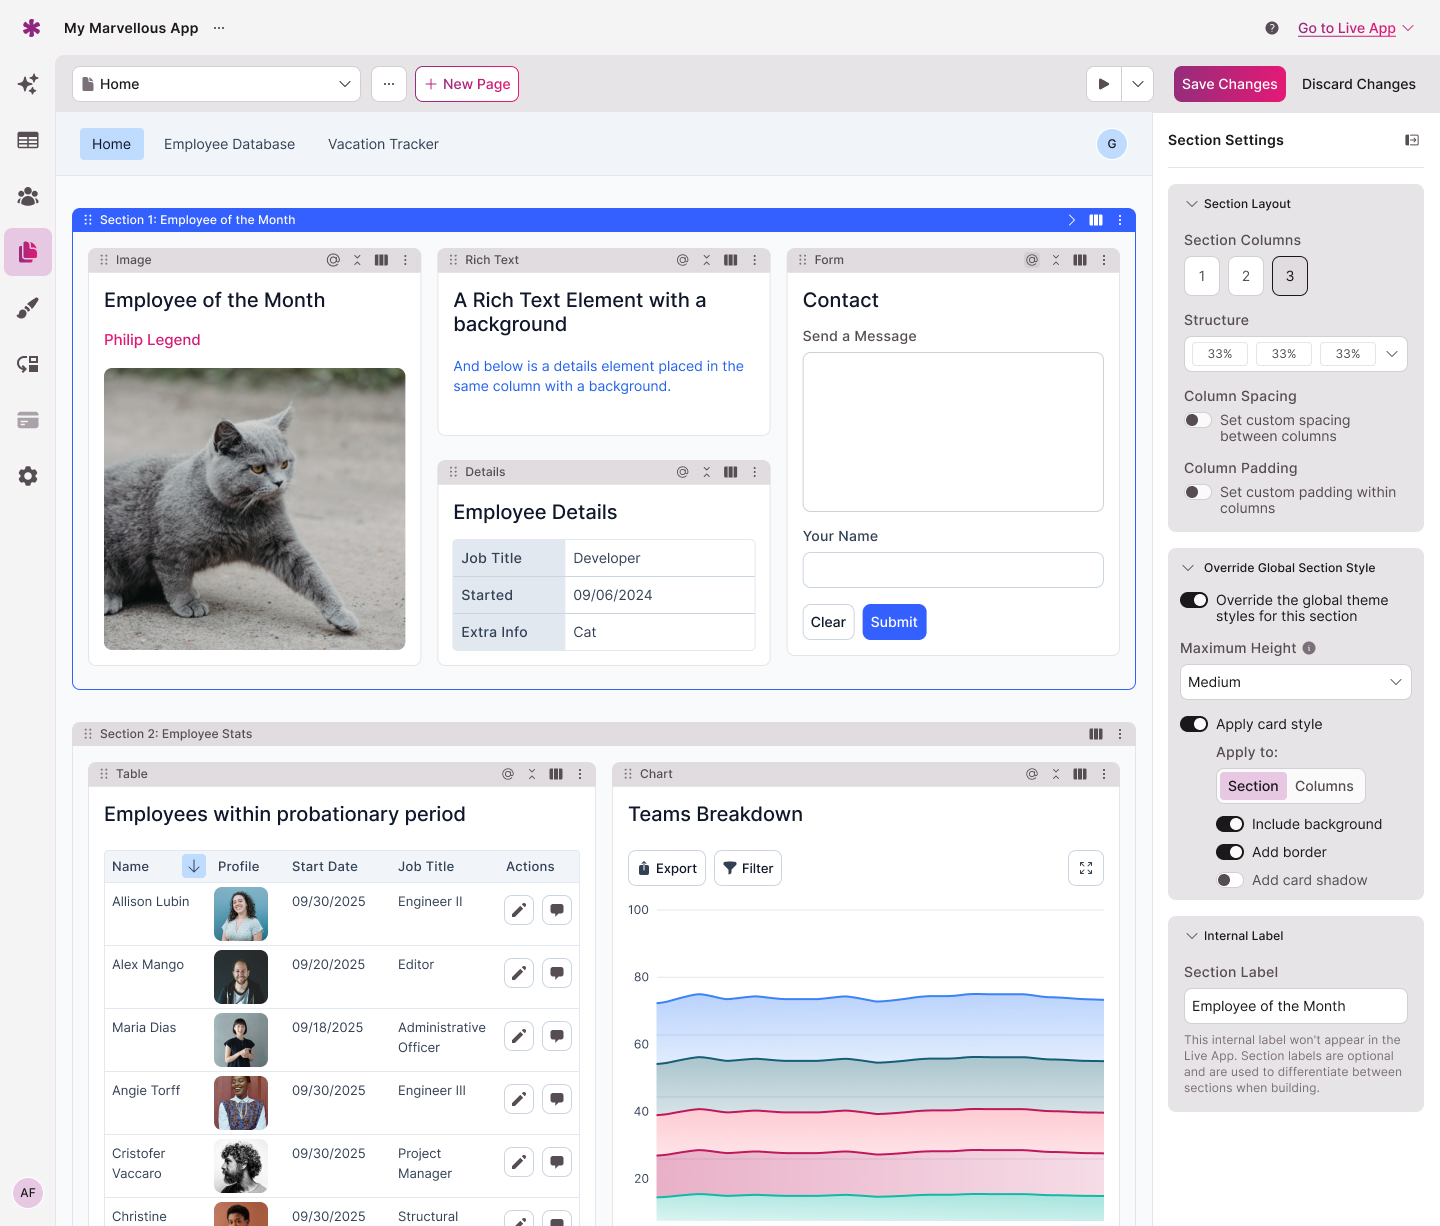
As the sole Designer at Knack, I have full responsibility for the end-to-end design of the entire ecosystem, including growing and maintaining our Design System and working with product managers to design, test and iterate on new features.
Knack is a no-code app building platform with over 110k businesses and independent creators using it to build and manage custom web applications without writing code.
The platform is highly flexible and comprises 2 parts which have very different target users. I am responsible for the UI and UX design of both:
- Builder interface: this is more technical and is where customers set up and manage their data, workflows, roles/permissions, and configure their end apps.
- End-user apps: the apps used by our customers' users. They are built using the Builder interface and need to be accessible, responsive, and very flexible to accommodate a wide range of app types.
Background
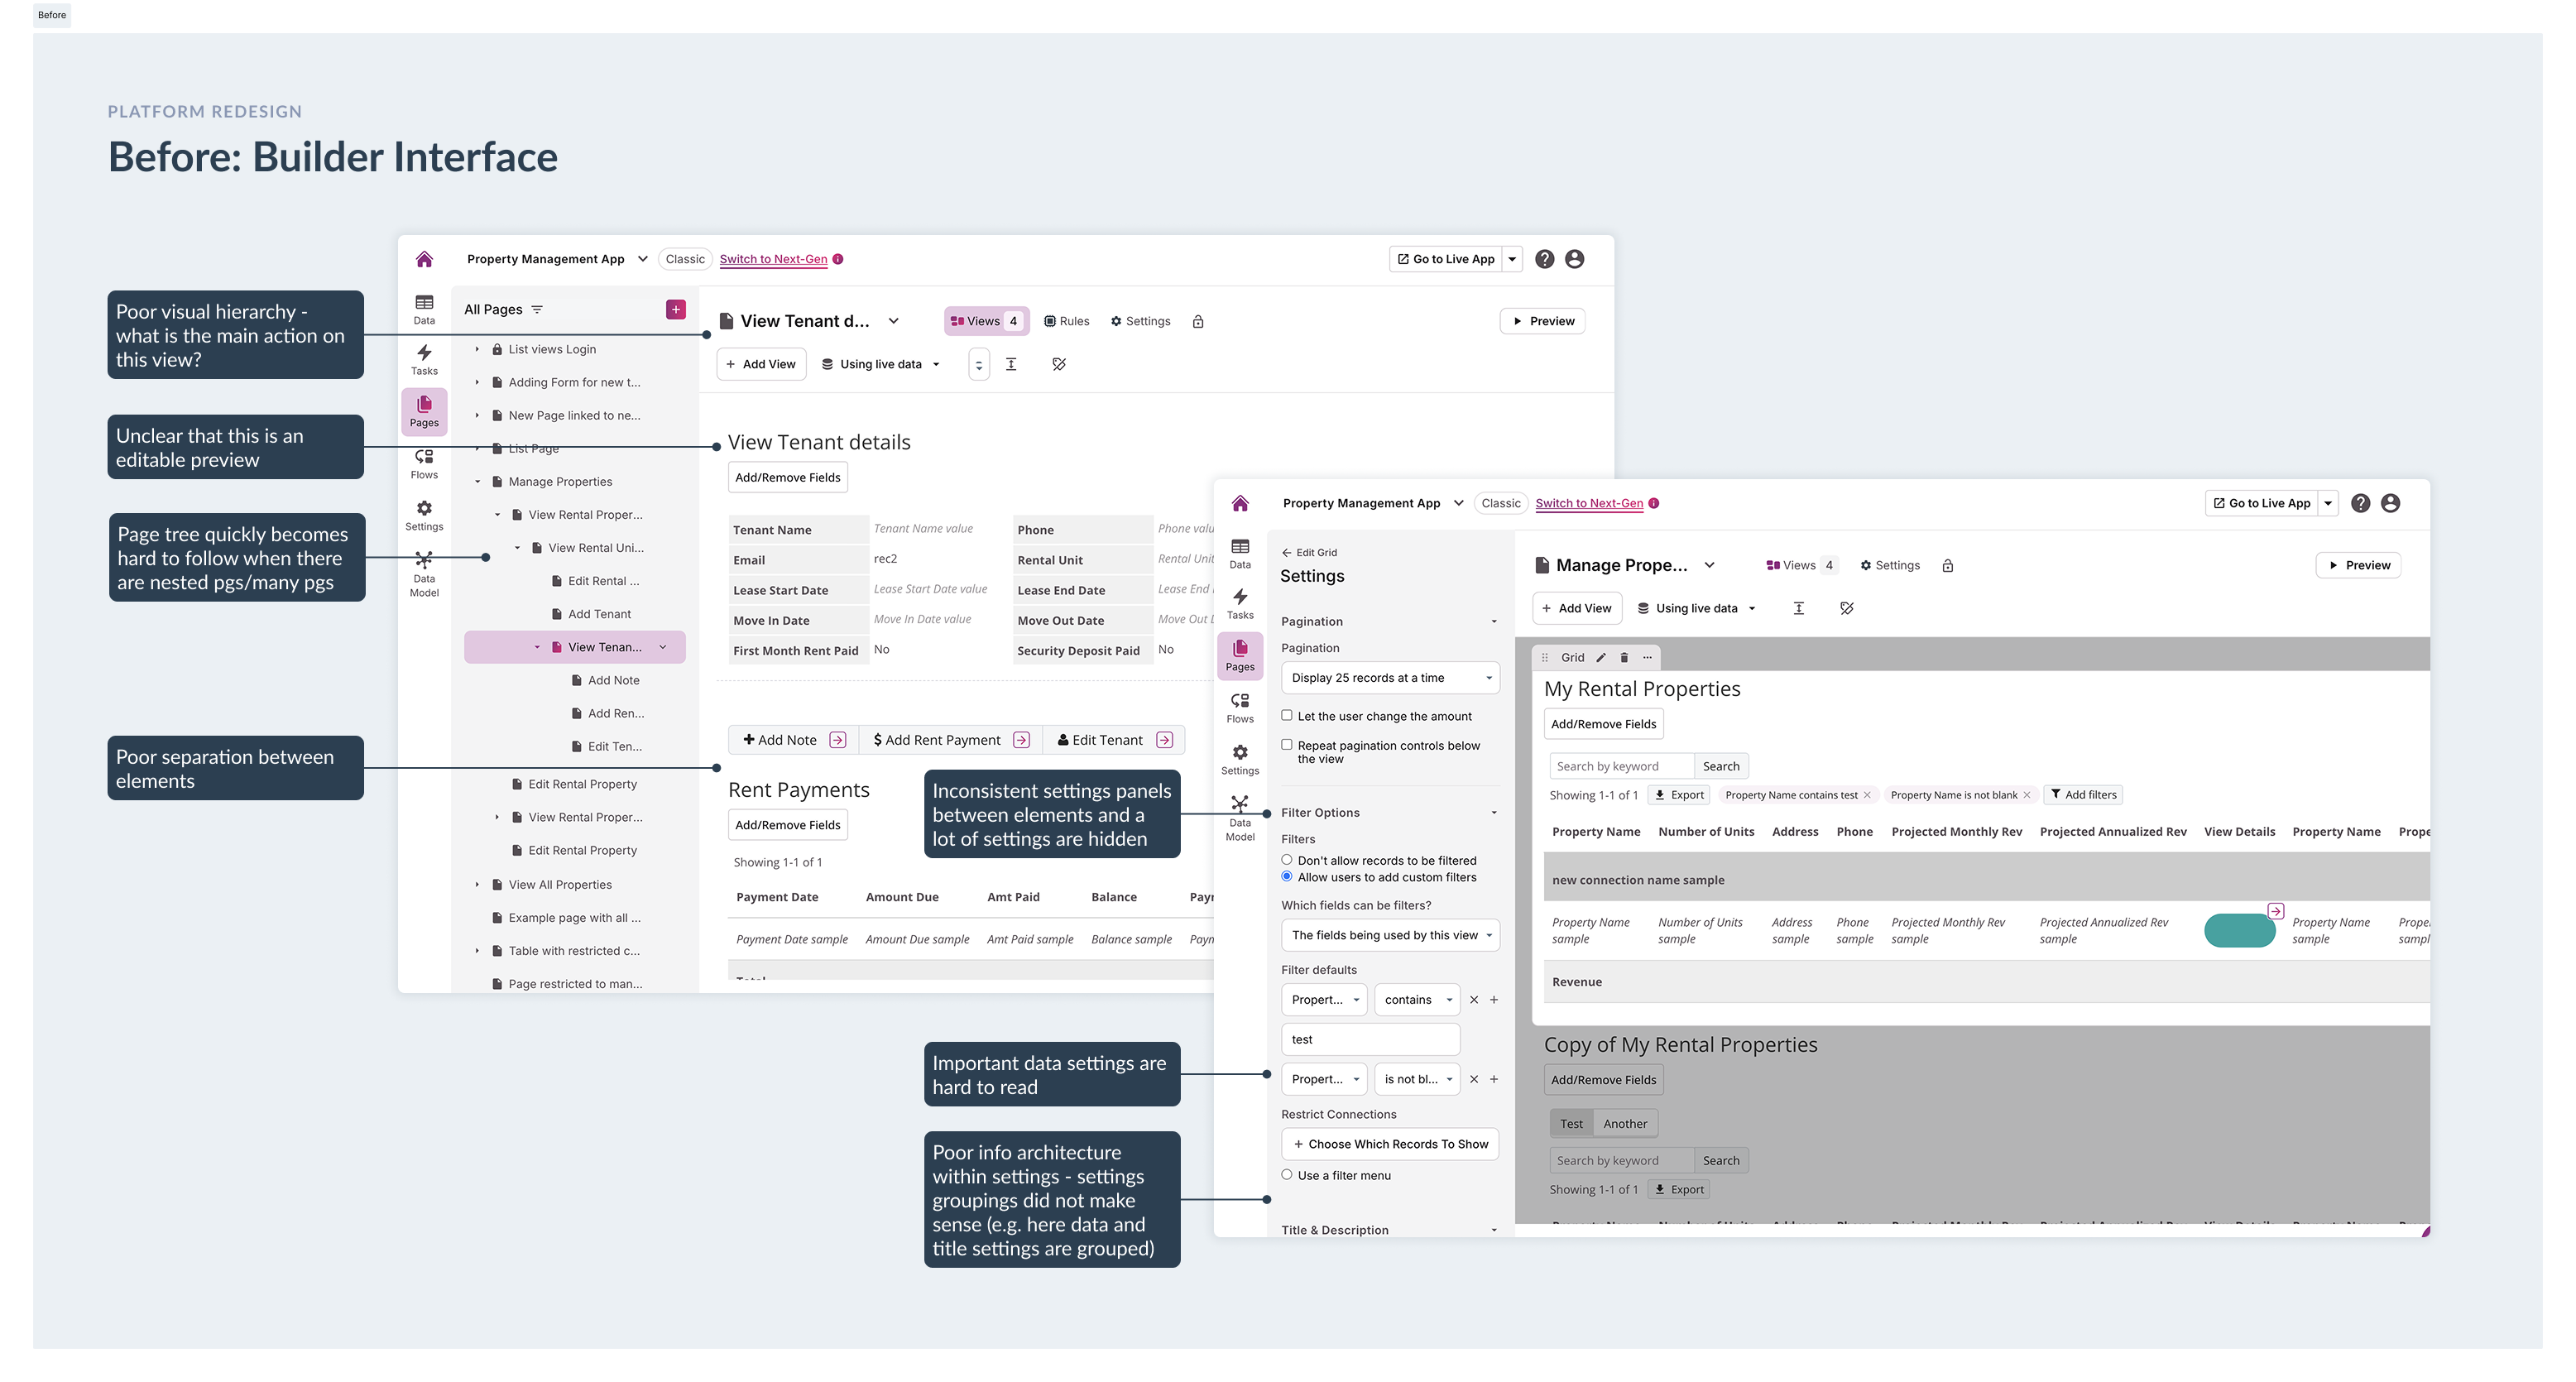
The platform had accumulated significant visual inconsistencies and tech/design debt over 10 years of incremental updates on top of a legacy codebase. The App-Builder interface was cluttered and difficult to navigate, and the themes and elements for the end-user apps were outdated and lacked visual consistency and the flexibility that customers needed. This was a full redesign project spanning 2 years, covering both the Builder and end-user App interfaces.
Project Aims:
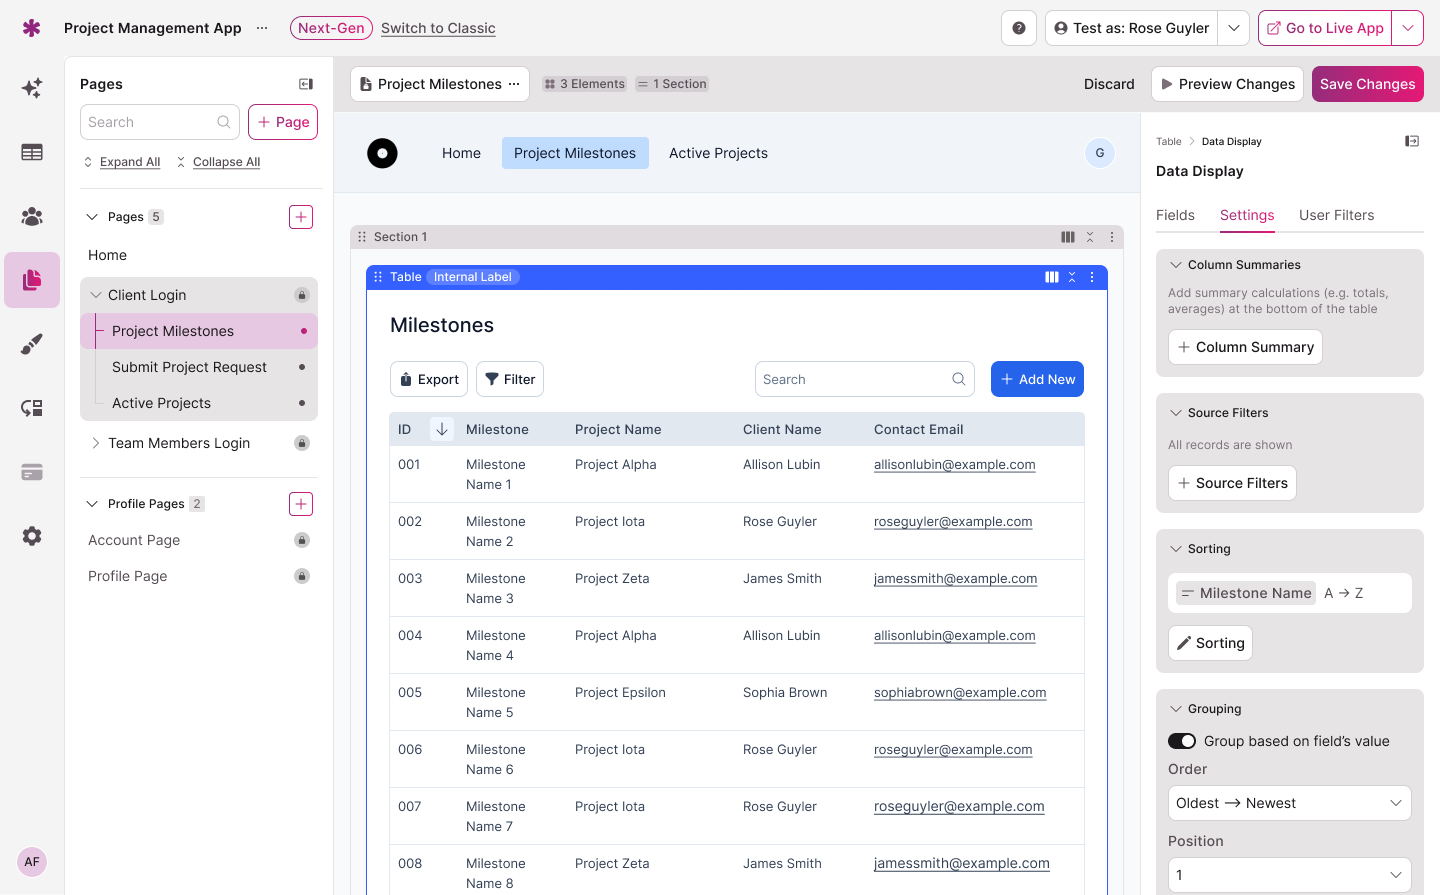
- Update the design system and patterns library to resolve visual inconsistencies and create unified, consistent interaction patterns and styling.
- Resolve problematic/unintuitive flows and UX within the Builder interface to allow users to manage their data more easily and build apps faster.
- Build on the Live App capabilities and styles to allow more flexibility.
Team
I was the permanent designer on this project, working with:
Problems to Solve
We had identified the main interconnected UX/UI problems based on user feedback and heuristic reviews. These problems touched both the Builder interface and the end-user apps. Part-way through the project we shifted our focus to be almost entirely on the Builder side. This was due to the wider adoption of AI and the need to shift the end-user app setup to be a more flexible and AI-driven to match shifting user expectations. This meant the redesign work specifically centred on improving existing end-user app elements and themes features was put on hold in favour of a separate AI integrations project.
Builder Interface Problems
- We needed to distil a highly complex system into a coherent, manageable, clear interface. This was based on longstanding feedback that the UI was overwhelming, with a steep learning curve.
- Poor information hierarchy: users lacked guidance, quickly became disoriented in the system, and struggled to understand wider implications of some settings.
- Hard to discover features: barrier to successful onboarding and led to churn and our Customer Success team spending a lot of time educating users.
- Visual inconsistencies and confusing layouts: cognitive overload in settings areas.
End-User App Problems
- We needed to modernise the overall look and feel options based on feedback that it was outdated and lacked flexibility.
- We needed a system that produced good baseline results across various brand contexts and custom themes.
- Data visualisation components in particular were very limited and outdated.
This part of the project was put on hold due to a shift in focus to an AI-driven frontend for the end-user apps.
General Challenges
- Mix of less-technical and tech-savvy users: difficult to balance simplicity with the complex features required by some users.
- We needed to continue supporting legacy apps without creating separate design systems.
- Components were shared between the Builder and Live App.
- We had a nascent design system with limited documentation and components which had been built in the platform but were not included in the design system.
- The project needed to include a time-consuming refactor of the legacy codebase.
Redesigning the Information Architecture
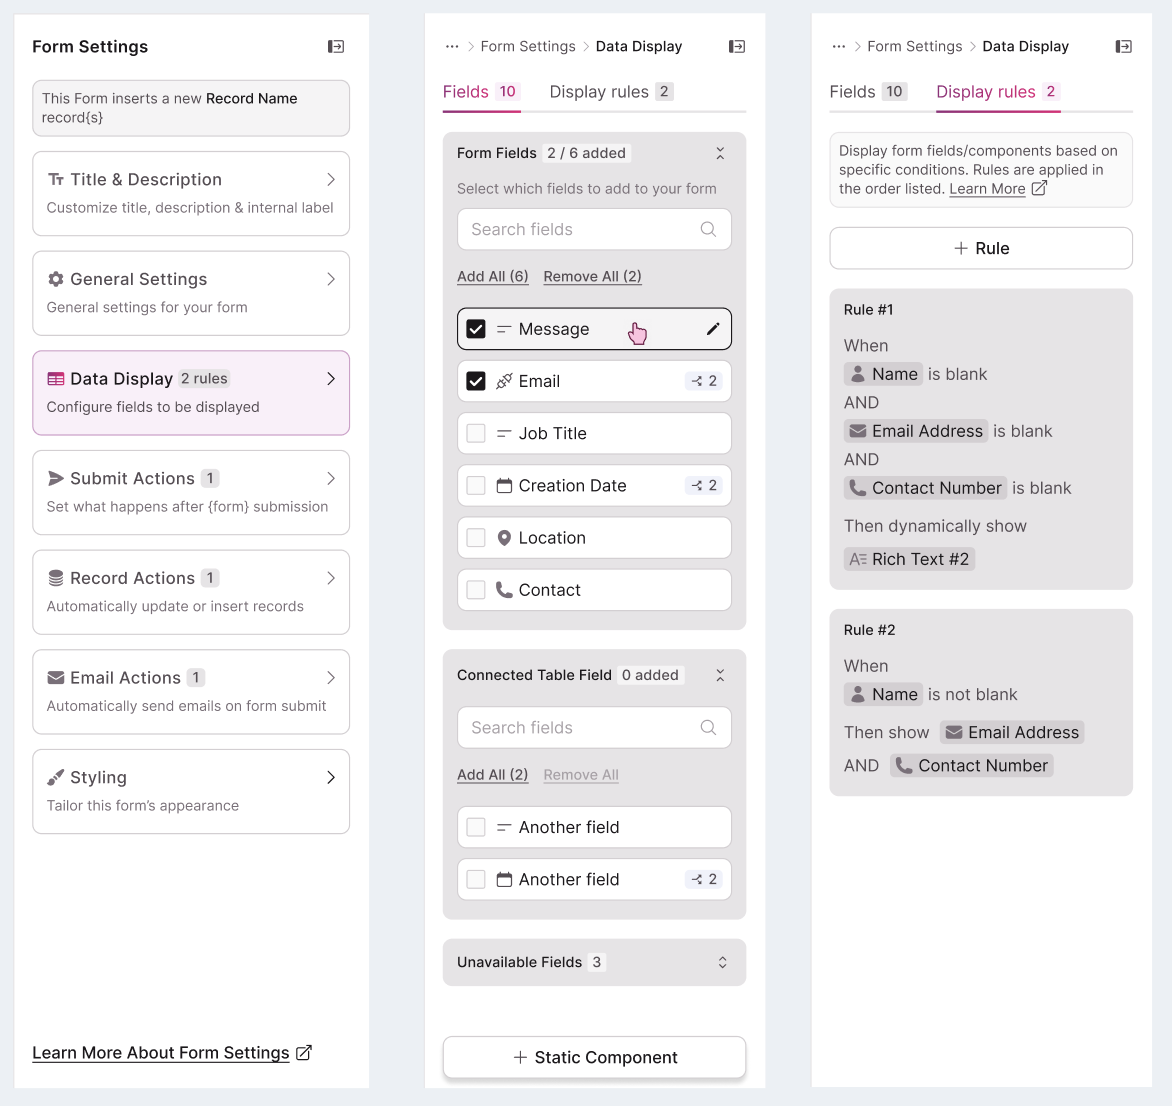
A key part of the redesign project was the restructure of information architecture for the various element and page settings, which were shown in a Page Editor view. We knew from feedback that this was the main area where users got lost in the settings and found it hard to discover features and configuration options.
Problems
- Inconsistency across elements: we lacked standard, reusable, documented patterns which meant the settings were unpredictable from one element to another.
- Illogical groupings of settings: there was a mismatch between the implementation and users' mental models.
- Convoluted paths to some settings which were hidden and hard to get back to, or just not discoverable at all.
Information Architecture Approach
We started by reviewing the problems and, specifically, the main areas to focus on. We had available to us some easily-accessible resources to help with this review and prioritisation exercise:
- Customer Success team: colleagues who were able to provide context and share their knowledge of customer feedback over many years.
- Partner Builders: people/agencies building Knack apps for their clients were able to share their experiences and opinions on efficient building.
- We already had a backlog of customer feedback in Jira that we could also utilise.
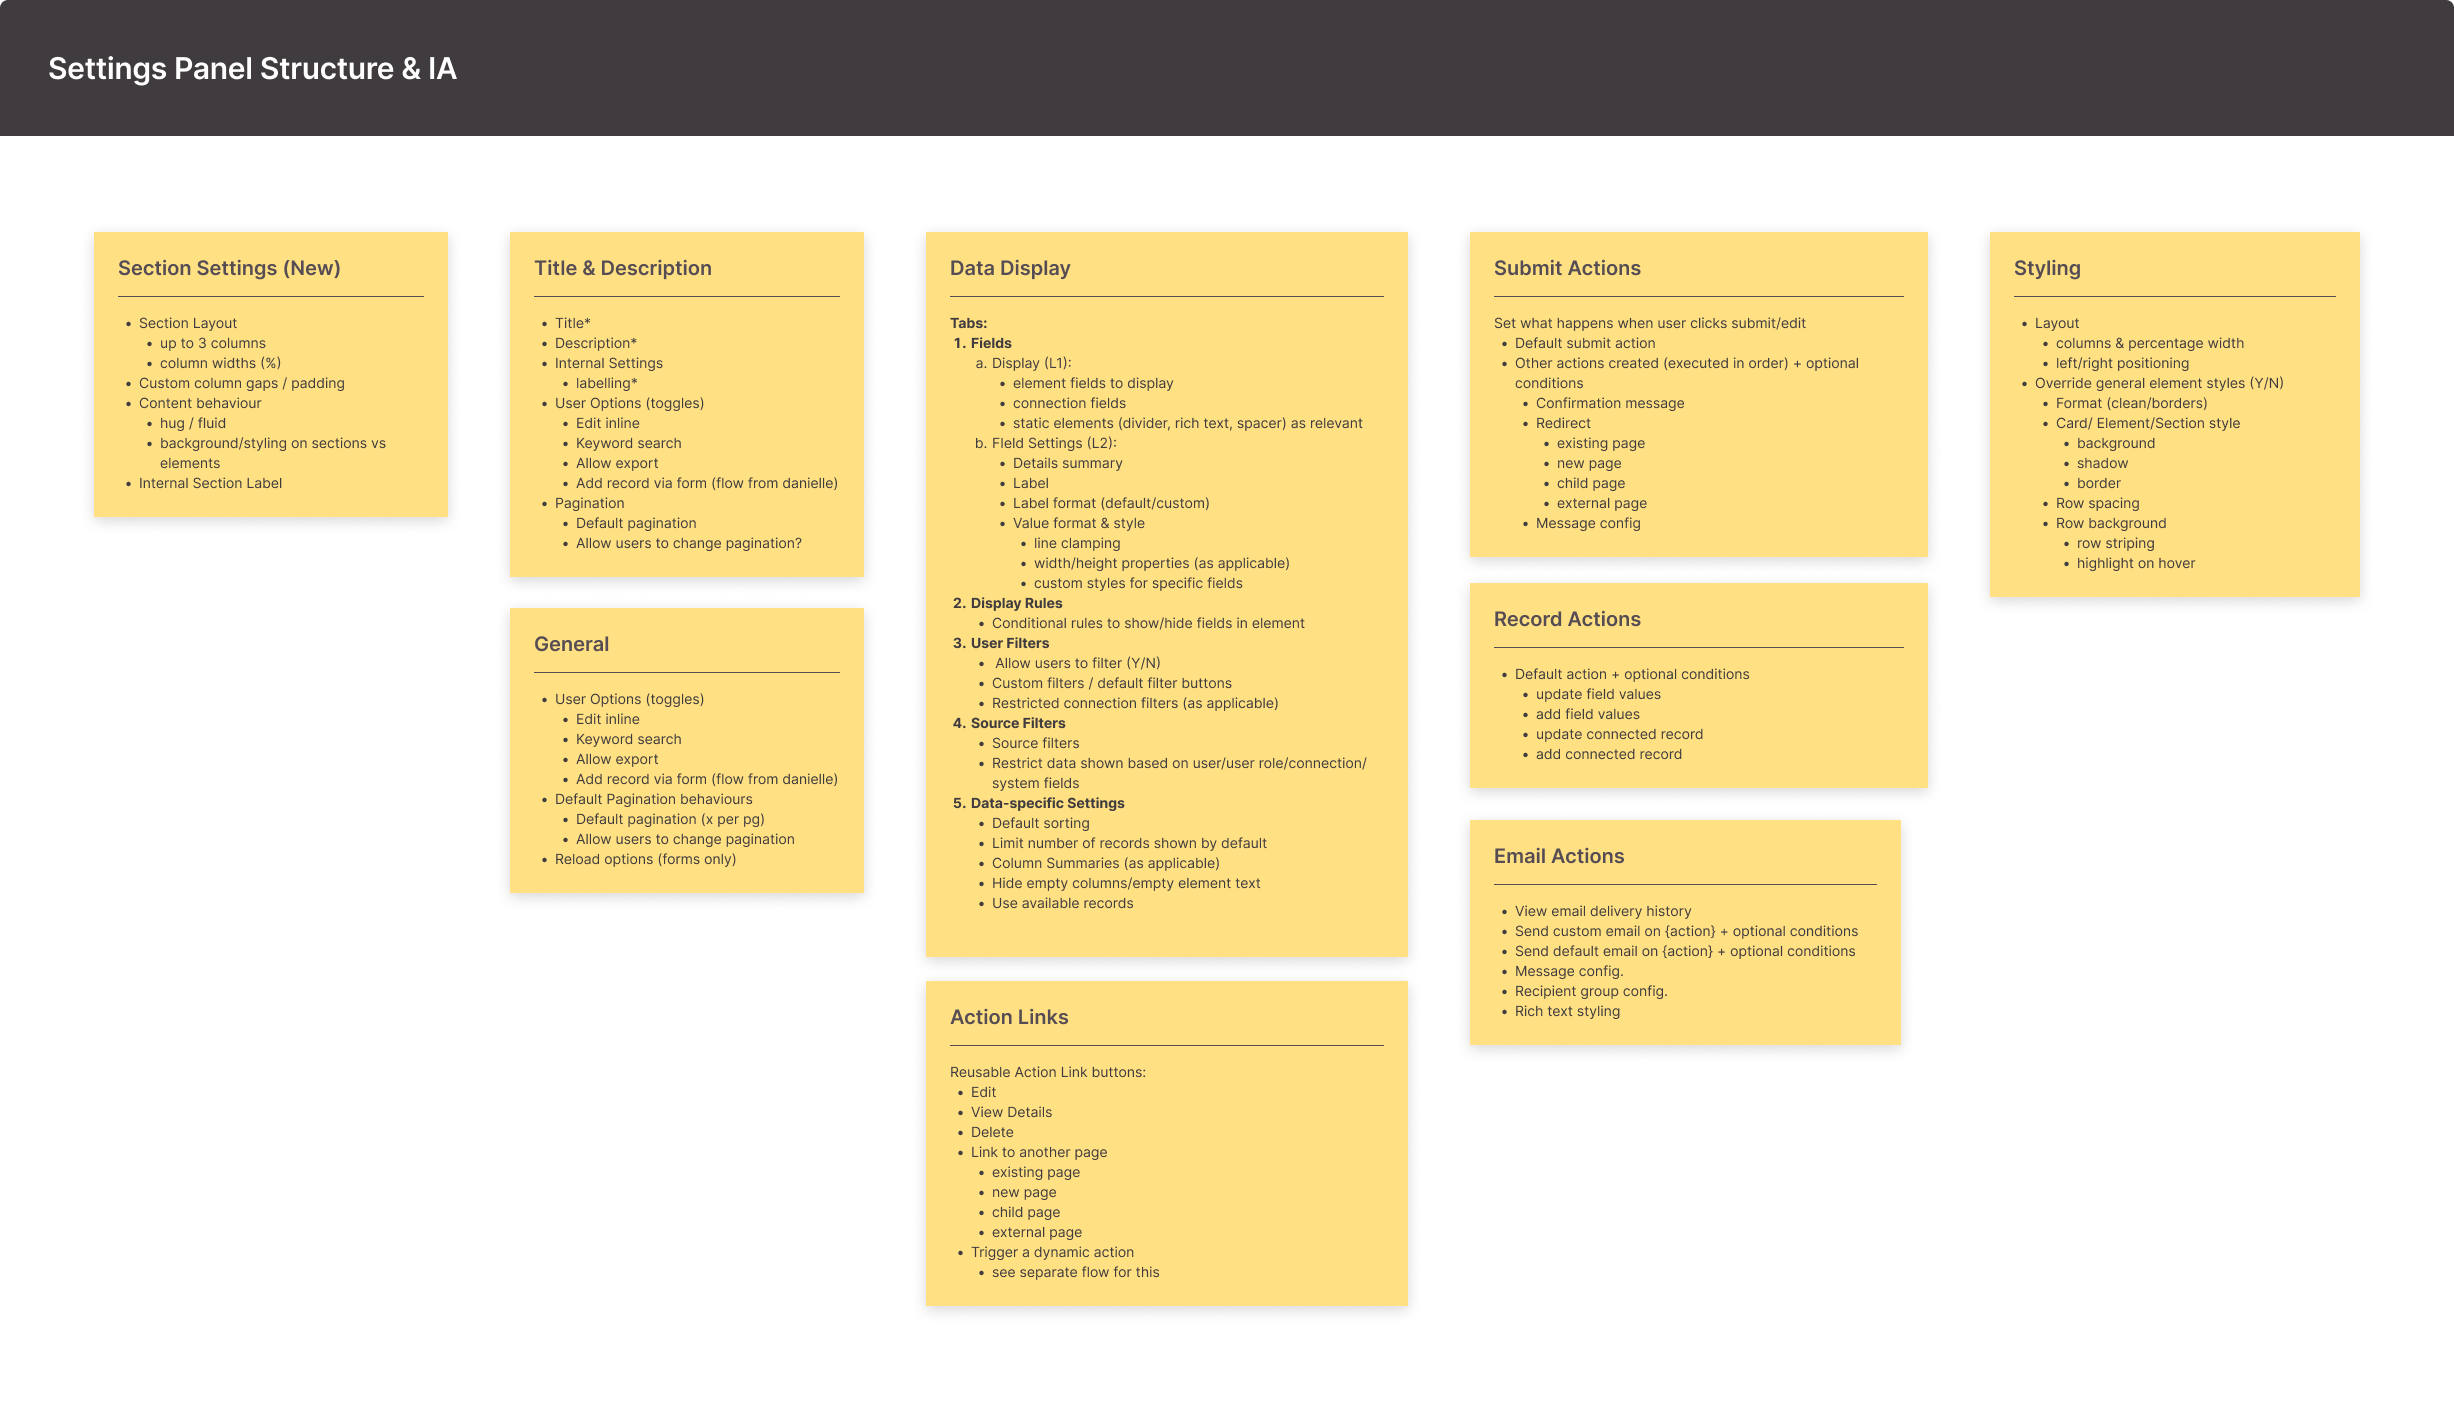
1 Reviewing & Mapping
- Mapped all element settings
- Reviewed to find commonalities between elements
- Identified missing settings and inconsistencies (e.g. tables had some extra settings which pivot tables did not have, but should have had).
- Simplified and streamlined config options by combining them if relevant
- Sunset unused settings (determined via usage data and CS Team feedback)
2 Restructuring IA
- Reorganised and grouped settings
- Created new groups and options as needed
- Tested groupings with CS and customers periodically to ensure matching mental models
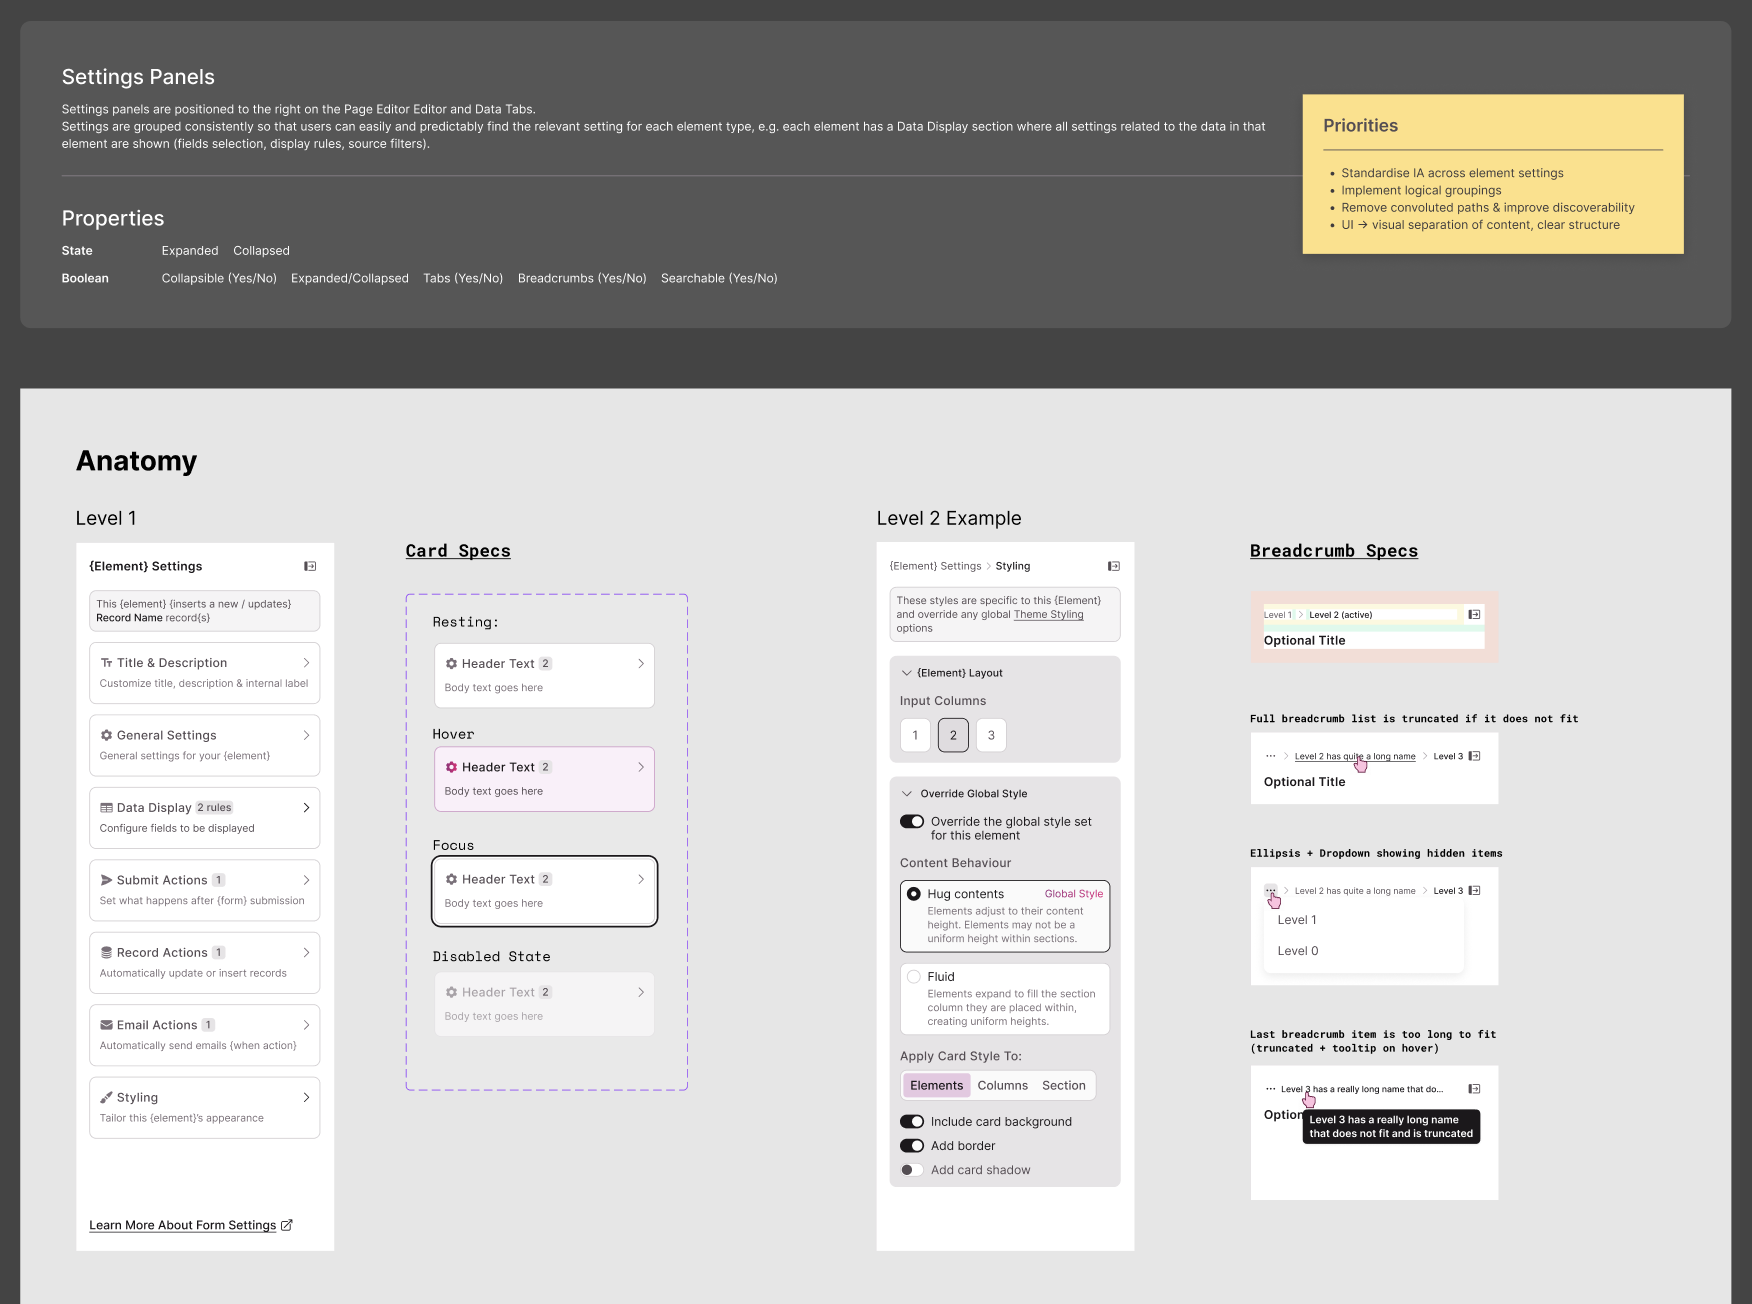
- Added new breadcrumbs pattern to address feedback about settings being difficult to navigate
3 Designing Consistent Patterns
- Created a new standard pattern applied across all elements
- Documented the new patterns and guidelines
- Updated components in the design system to correct any UX or UI issues
- Added missing components to the design system and resolved those with incorrect states
- Worked with engineers on feasibility issues which came up when moving/streamlining some settings
IA Constraints and Challenges
Design system changes had to be compatible with the old/legacy version: we could not introduce changes that would significantly alter/break existing end-user apps. Changes which affected the Builder area were fine, but the challenge was updating shared components.
Unforeseen technical issues when updating the UX of some settings/features: sometimes streamlining configuration options, or grouping them, led to schema changes which caused technical issues.
Legacy codebase: often engineers did not know about feasibility issues until they began work on an area of the platform. This was simply a consequence of working with an old codebase in need of refactoring.
A general challenge with the re-design was balancing feedback on the new designs with the familiarity of the old designs.
IA Restructure Outcomes
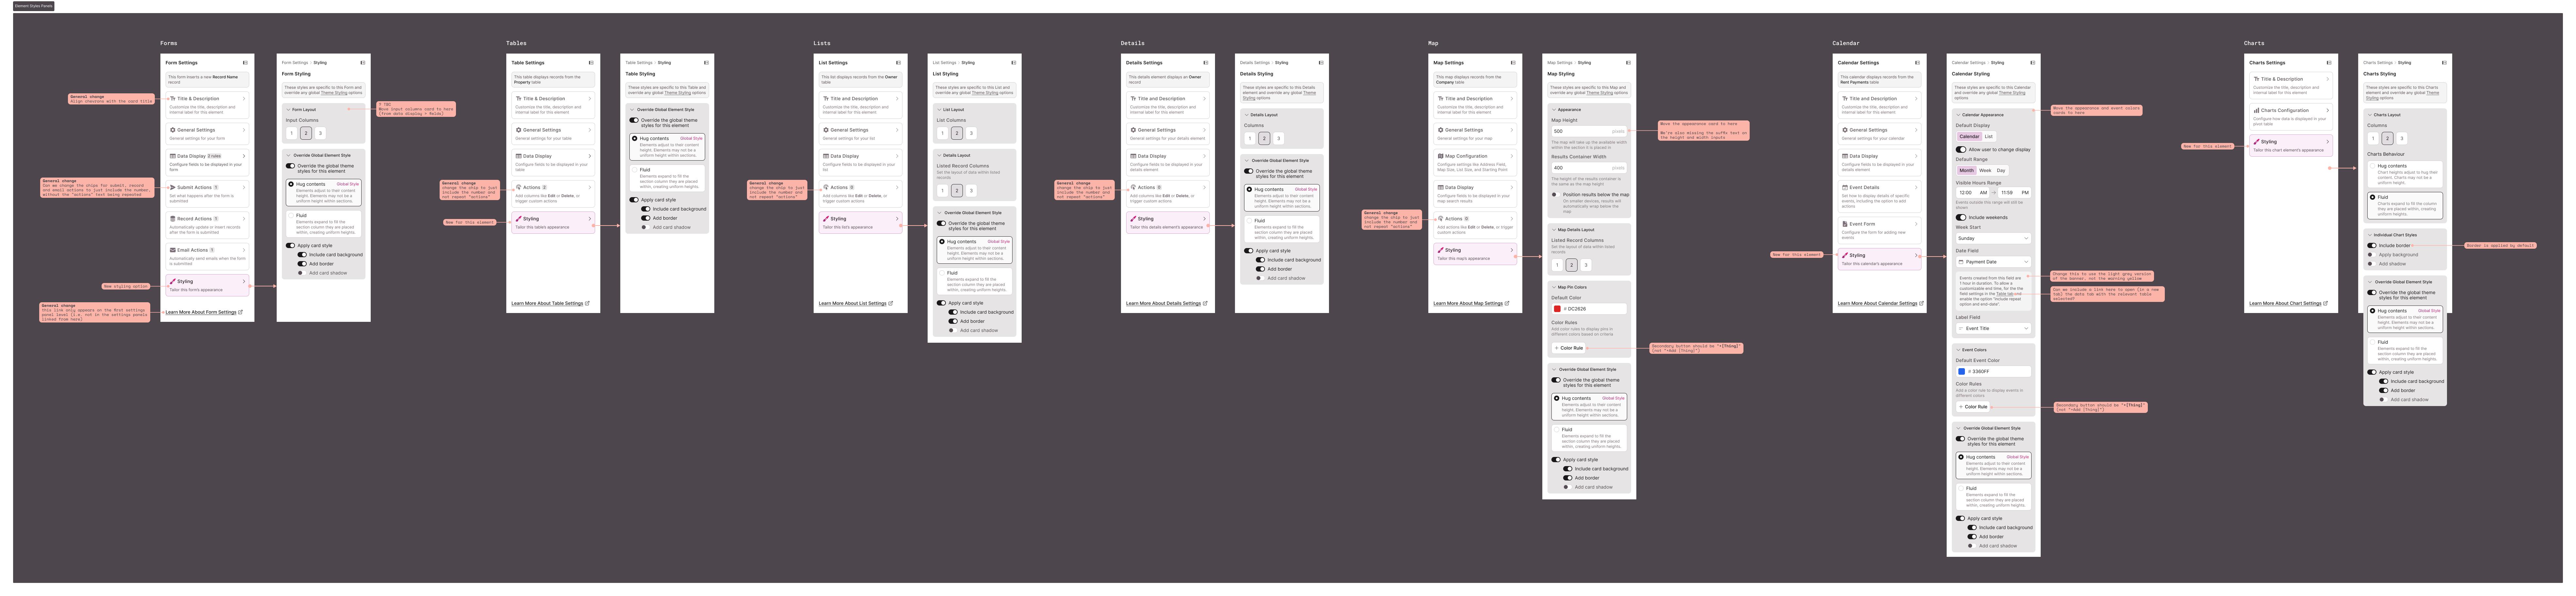
New Information Architecture
- Logical settings groups, consistent across elements.
- Consistent layout pattern to ensure predictability - Level 0 card groups > Level 1 + tabs > Level 2.
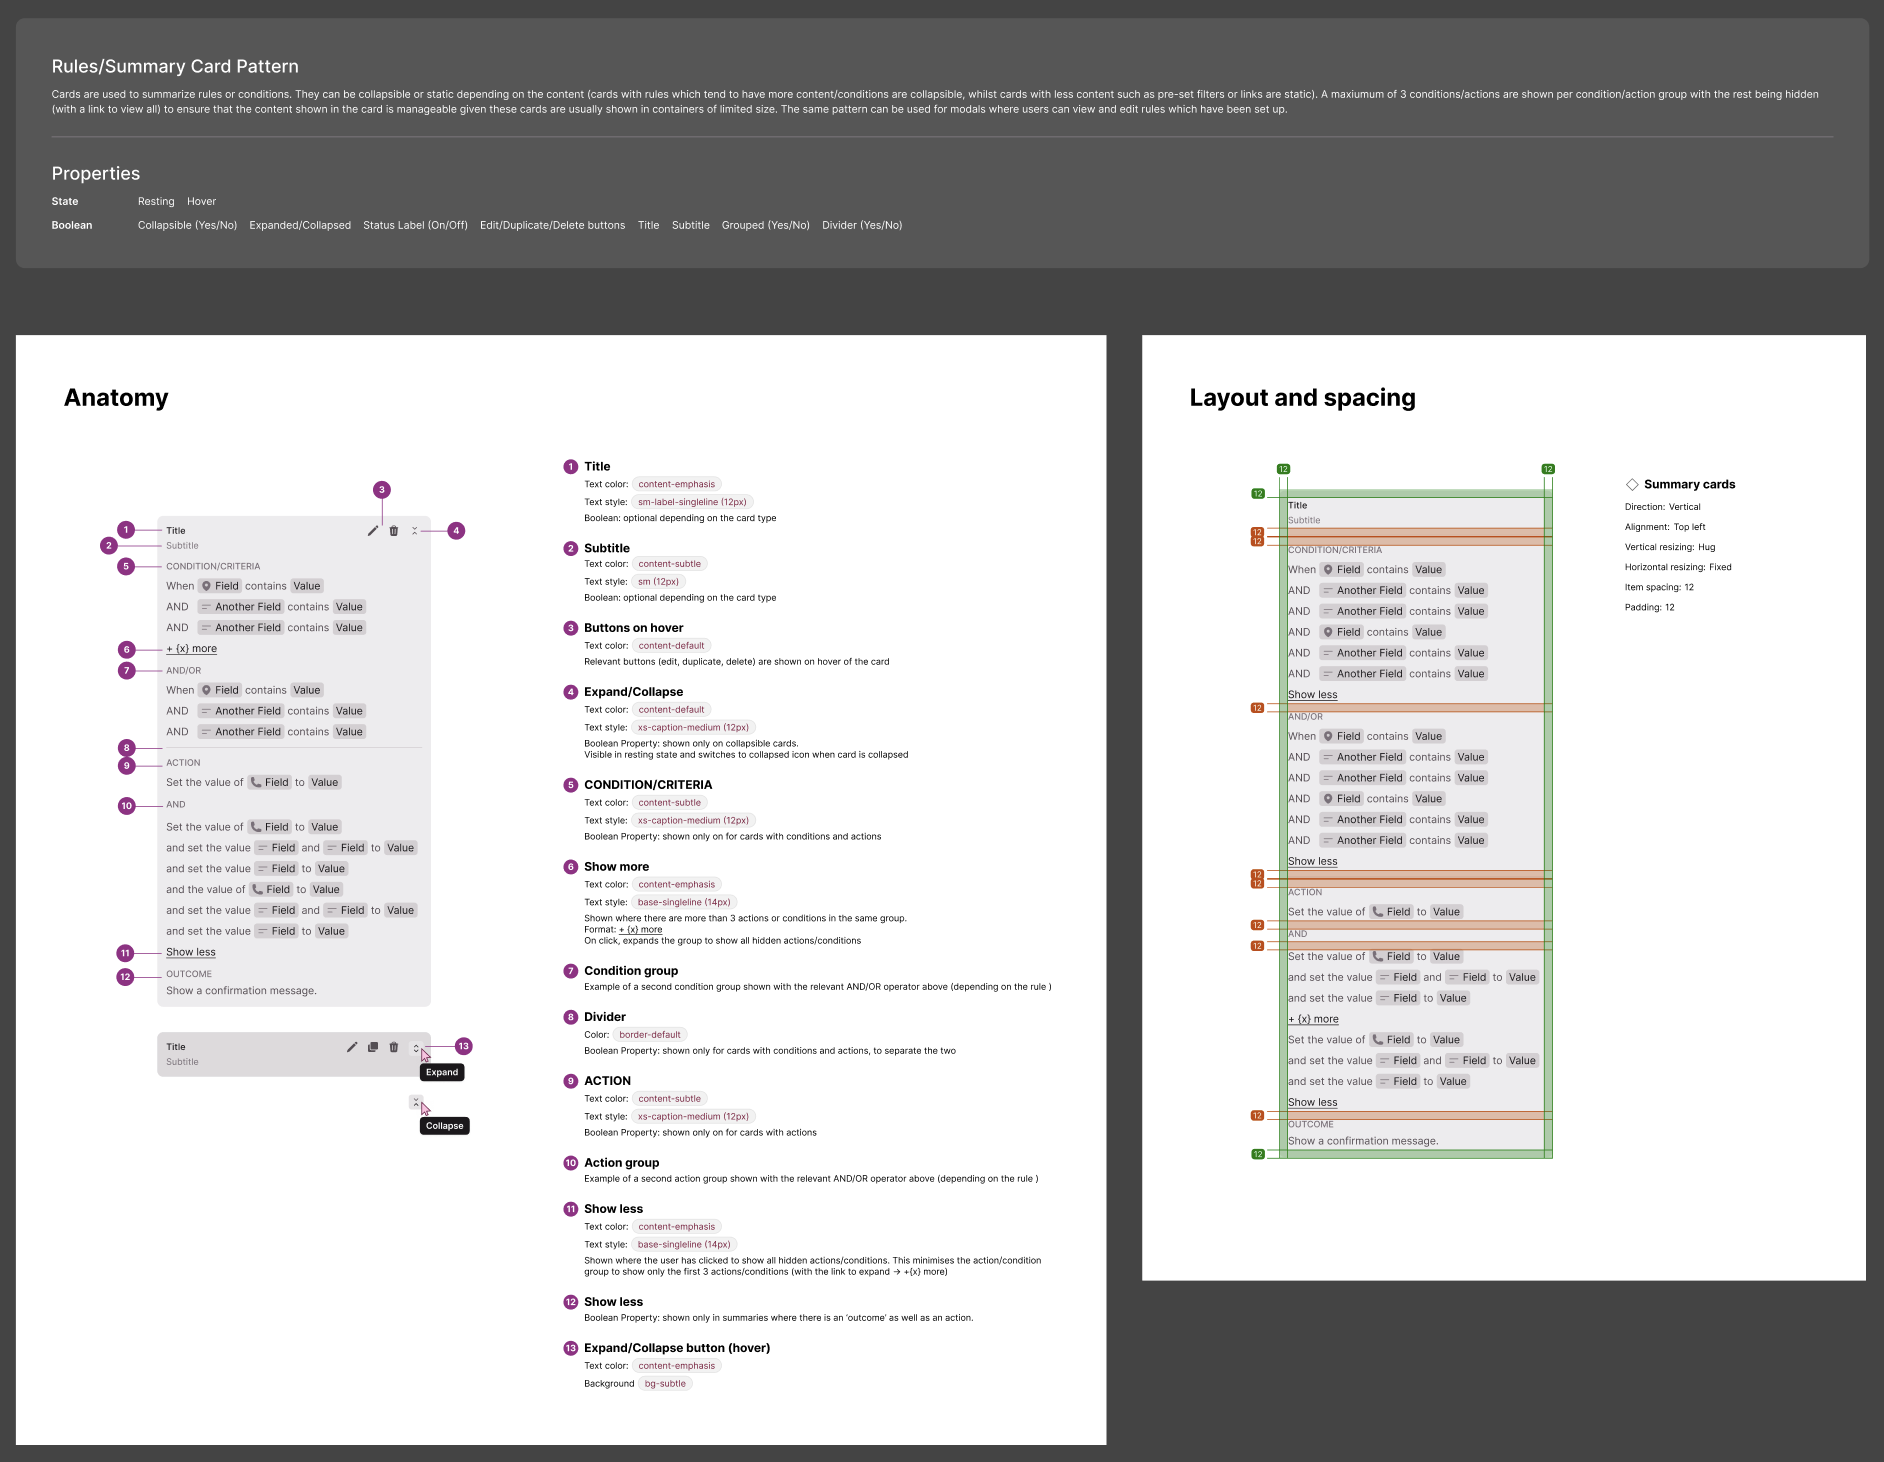
- Consistent card pattern for rules, actions, and conditions - more readable, with less truncation.
UX & UI Improvements
- Clear visual separation via cards - content is easier to parse.
- New breadcrumb pattern to better orient customers and improve navigation.
- Collapsible cards within the panels to maximise space and allow users to close sections as desired for more focused work.
- Improved ribbons in the preview.
Overall Redesign Project Results
The overall output at the end of the full project included:
- A re-designed, comprehensive, fully-documented design system, scaled to accommodate multiple themes, new components, presets and elements.
- A reworked Builder interface with a streamlined UX and better data management capabilities.
- A reworked information architecture for the page-builder settings for a more intuitive experience, allowing users to build app pages more quickly and confidently, without getting overwhelmed or lost in a sea of poorly grouped settings.
Since the redesign launched, Knack has seen a 3.5% increase in trial conversion. All new customers and trialers are using the new redesigned version of the platform. We did encounter slower adoption, especially at first, for existing customers. The reluctance to switch to the new version can be attributed to a few key barriers to adoption.
Design System Impact
The component and design system work from this redesign now forms the foundation for all ongoing UI development, with consistent patterns and documented standards that allow new features to be designed and shipped more efficiently.
More solid, scalable design system:
- Total 106 component sets, plus variants.
- 63 new components.
- New patterns library with standardised, fully documented patterns.
Reflections
This was a long-term and, at times, challenging project. As with any long-term project, the need to regularly re-align and be clear on the goal was important. When this slipped, we fell into the trap of spending a lot of time going back and forth on certain features and details. Maintaining alignment mitigates this: if we can keep certain guiding principles in mind, we can better prioritise decisions and discuss trade-offs more effectively. I learned that using design reviews not only to discuss designs but to bring in user feedback and seek alignment was critical.
We were constantly balancing long-term improvements based on best practices and removing poor patterns with existing customers' familiarity. It's difficult to please all users, especially when there is a large existing user base of such varying technical abilities. We also had significant gaps in our data, so it was often hard to review the performance of certain features. We found working closely with the Customer Success team really valuable here, because it helped us cut to the most common feedback and use cases.
Background: Adding Role-Based Permissions
Users building no-code apps needed a way to control access to data stored in their Knack app based on user roles and defined permissions rules. We already had access restrictions set up for the end-user App, which allowed users to set access rules for which pages/page groups (and even which data on page elements) would be visible to end-users based on their role. We needed to advance this functionality to include the ability to restrict access to data tables in the Builder - for example, a receptionist at GP practice might have full edit access to the data table storing patients' details, but should have read-only access to the data table storing GP information.
My Role
I worked with others in the Product team (Product Manager, Head of Product) and a design contractor to scope out the work, and iterate on designs. We collaborated with the Customer Success team and tested designs with partner members to validate ideas and test flows to ensure they were understandable.
The Problem
As builders scale their apps, they need full control over data visibility and CRUD permissions in their data tables. We needed a way to allow users to set up data access permissions for their app to a granular level (down to CRUD permissions at a field level, not just per record). We needed this to be intuitive and easy to use so that no-code users (most of whom do not have the mental model of a developer or significant database experience) would be able to configure their settings easily and wtih confidence.
User Tasks
User Tasks
User Tasks
Approach & Design
Phase 1: Pre-defined Permissions
This was a technically complex project with a lot of backend setup work required, so we split it into two phases. The first phase included allowing users to set up basic, pre-defined permissions per table based on the role. The custom permissions, including the filters and field-specific permissions, were deferred to Phase 2.
For phase 1, we focused on a new matrix-style table (in line with industry standards and best practice) in a separate Data Permissions area in the part of the builder where User roles and Users were managed. From this table app-builders would be able to select a pre-defined permission level for each role per data table.
The pre-defined options were limited to start with, including Full Access, View Only, or No Access. For each table the permission could be set for records owned by the user, and separately for records owned by other users. For example, in an appointments management app for a GP practice, the Care Coordinator role might have full access to the patient records they own, which would be the patients assigned to them, but view-only access to patient records owned by other coordinators.
Feedback and Next Steps
After phase 1 was released, we gathered feedback from early adopters via the CS team, feedback that was sent to us and outreach by the Product Manager to partners. The main feedback included:
- Matrix view quickly became cluttered when there were a large number of tables because of the dual columns required for each table, and with more than a few roles it required horizontal scrolling to see the full picture
- it was confusing to manage the All Users table because there was so much data on screen, and no visual grouping to separate data tables from user tables
- initial setup was cumbersome because each column had to be configured individually, with no way to set a default and adjust the exceptions
- it was hard to tell at a glance which parts of the matrix had been deliberately configured and which were still sitting on their default values
Some of this feedback was anticipated and was simply a result of phase 2 not having been rolled out yet, but we tested designs for phase 2 to ensure we were creating something that was usable for most people and didn't require them to already be familiar with CRUD permissions management or database structures.
Phase 2
Fixes based on Feedback
The first set of phase 2 designs addressed the problems identified in the feedback with the matrix grid:
- Grouping user tables and data tables into collapsible row groups to reduce visual load. This allowed for more focused working and also meant I could move the icons indicating the table type to the row group headers rather than repeating them per row, which also helped with the visual load problem.
- Allowing users to set permissions for groups of tables from the row group headers. This reduced the time taken to initially set up permissions, and gave builders a way to set a broad default and then adjust the individual tables that needed to differ. We can expand on this in the future by including batch editing options in a later phase.
- Adding in missing functionality, such as search and filter options, which became necessary once apps had more than a handful of tables.
- Adding a summary of the access levels (Add, View, Edit, Delete) on row for specific user role tables (not the overall matrix, as this would add too much content to that table), so builders could easily see permission levels at a glance.
Alongside the main matrix table showing all user roles, each user role has its own Data Access tab showing a version of the same matrix but limited to that specific role. This gives a summary of what that specific role can access across every table and is used for more specific workflows e.g. when builders are checking 'what can Care Coordinators access?'' this view is more targetted. Keeping the same matrix pattern in both places meant builders were familiar with the UI, but could approach access permissions from either direction depending on their goal (e.g. 'what can Care Coordinators see' vs 'who has access to the Patients table?').
Adding a Custom Option
The Custom option had been planned for phase 2 and required a user testing of the designs to ensure we were creating something intuitive that builders were able to use confidently. To restrict access based on conditions as well as user role, I reused an existing pattern we have elsewhere in the Builder which allows users to set up filters and filter groups. The Custom option also allowed users to set up field-level permissions, so that certain user roles would have permission to view and/or edit records but would also be able to exclude certain fields from that. This was particularly important for HIPAA customers who might want to restrict sensitive data in records to only be visible or editable by certain roles, whilst keeping the rest of the record visible/editable.
We identified several problems with the first (Figma) versions of the Custom option design:
- Relationship between the View, Edit and Delete sections wasn't obvious. A user can only edit records they can view, but the UI in the initial design did not make this dependency visible, so it was possible to set up an edit rule that looked like it granted access it didn't actually grant. This is obvious when thinking about it (e.g. I can't edit something I can't see) but that required extra cognitive load on the user, and the fact this was not spelled out could lead to a lack of confidence in the Custom permission being created.
- Wording used was too technical. It was closer to the underlying data structure and not close enough to how builders describe what they want. It led to confusion and made the feature harder to use for less technical users.
- Rules/filters had to be built from scratch. We identified a common use case of needing to restrict a role's view/edit permissions to their own records. Showing this as a pre-built option not only meant users could then add that option with a single click, but also provided an example for how these filters could be used.
- Field-level permissions at the bottom of each section were not obvious enough and were easy to miss.
Working Prototype
Based on the feedback I iterated on the Figma designs. Instead of continuing in Figma, I created a Claude Design prototype, partly because it was important when testing the design to be able to show a fully-functional prototype, and also because it was easier to demo to engineers and other team members because I was able to build in the multiple settings, combinations of options, and flows we needed. I had previously imported our design system into Claude Design so I was able to use our components in the prototype, and I imported the relevant Figma screens as a starting point.
Key changes included:
- Reducing visual overload by grouping user tables and data tables into collapsible row groups. This allowed for more focused working and reduced visual load. This also meant I could move the icons indicating the table type to the row group headers rather than per row which also helped with the visual load problem.
- Allowing users to set permissions for groups of tables from the row group headers. This reduced the time taken to initially set up permissions. We can expand on this in the future by including batch editing options in a later phase.
- Adding in the missing functionality, such as search and filter options.
- Including the missing Custom option to give the granularity needed. This was always going to be included in phase 2, but it required a lot of testing to ensure we were creating something people had confidence in using. I utilised an existing pattern we have elsewhere in the Builder which allows users to set up filters and filter groups. The Custom option also allowed users to set up field-level permissions.
Here is the final, functional prototype:
Reflections & Learnings
Splitting this into two phases was necessary because of the backend work needed but it did mean releasing something that was incomplete/did not have the full functionality our users needed and much of the phase 1 feedback was about problems we already had solutions planned for. The phased roll-out meant it was at times difficult to separate the issues from the design itself from issues that were simply due to the implementation not being complete. However, what was useful was where the feedback shows us where the phase 1 approach did not work at scale, which we improved in the phase 2 designs.
Building a working prototype rather than static designs was useful for this project because the access permissions had many possible setup combinations, flows and dependencies. Being able to click through those combinations surfaced problems that wouldn't have come up in a static Figma design. I still used Figma to spec out more detailed components and UI patterns, but the prototype was much easier to talk through with engineers, user and other team members. With hindsight, it would have been useful to have the prototype for the phase 1 designs.
Reusing the existing filter group patterns we already had elsewhere in the Builder reduced the learning curve for the user because the pattern was familiar - taking the approach to reuse patterns wherever we could, even where a purpose-built pattern might have been slightly more efficient in isolation was a simple, efficient way to reduce cognitive load.
Phase 2 has not yet been implemented, so the designs above are the tested prototype rather than the shipped feature. The main open question is whether the Custom option gives builders enough confidence to use it without needing support - this is something we will be able to measure once the feature has been rolled out.
Page Tree Redesign
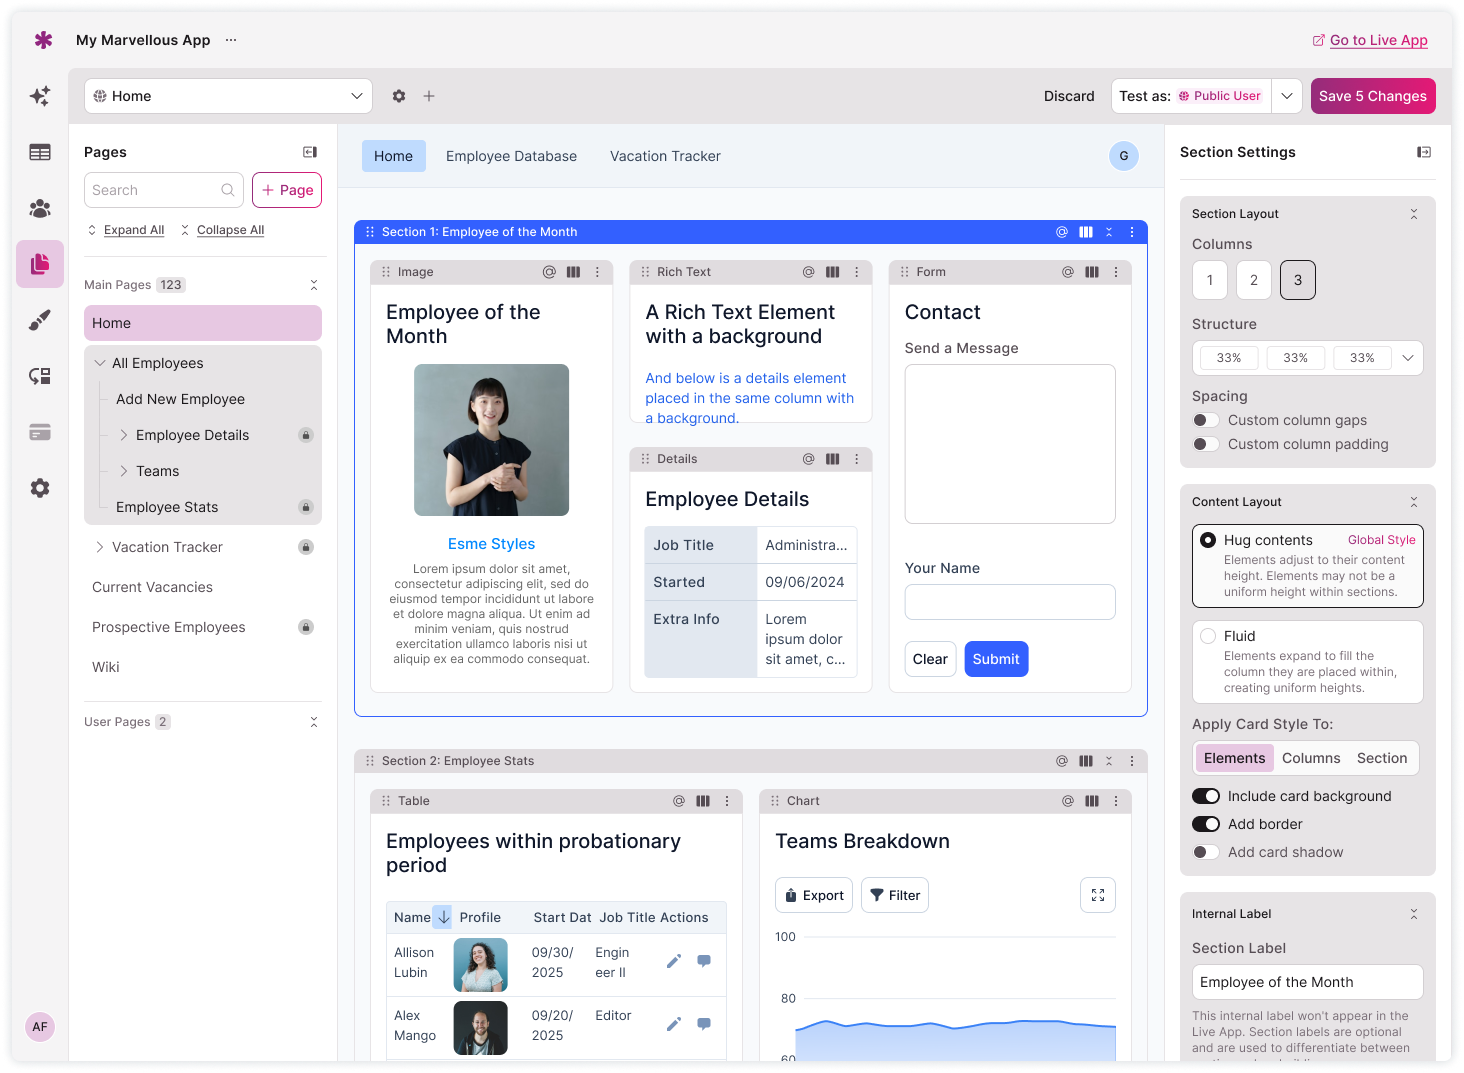
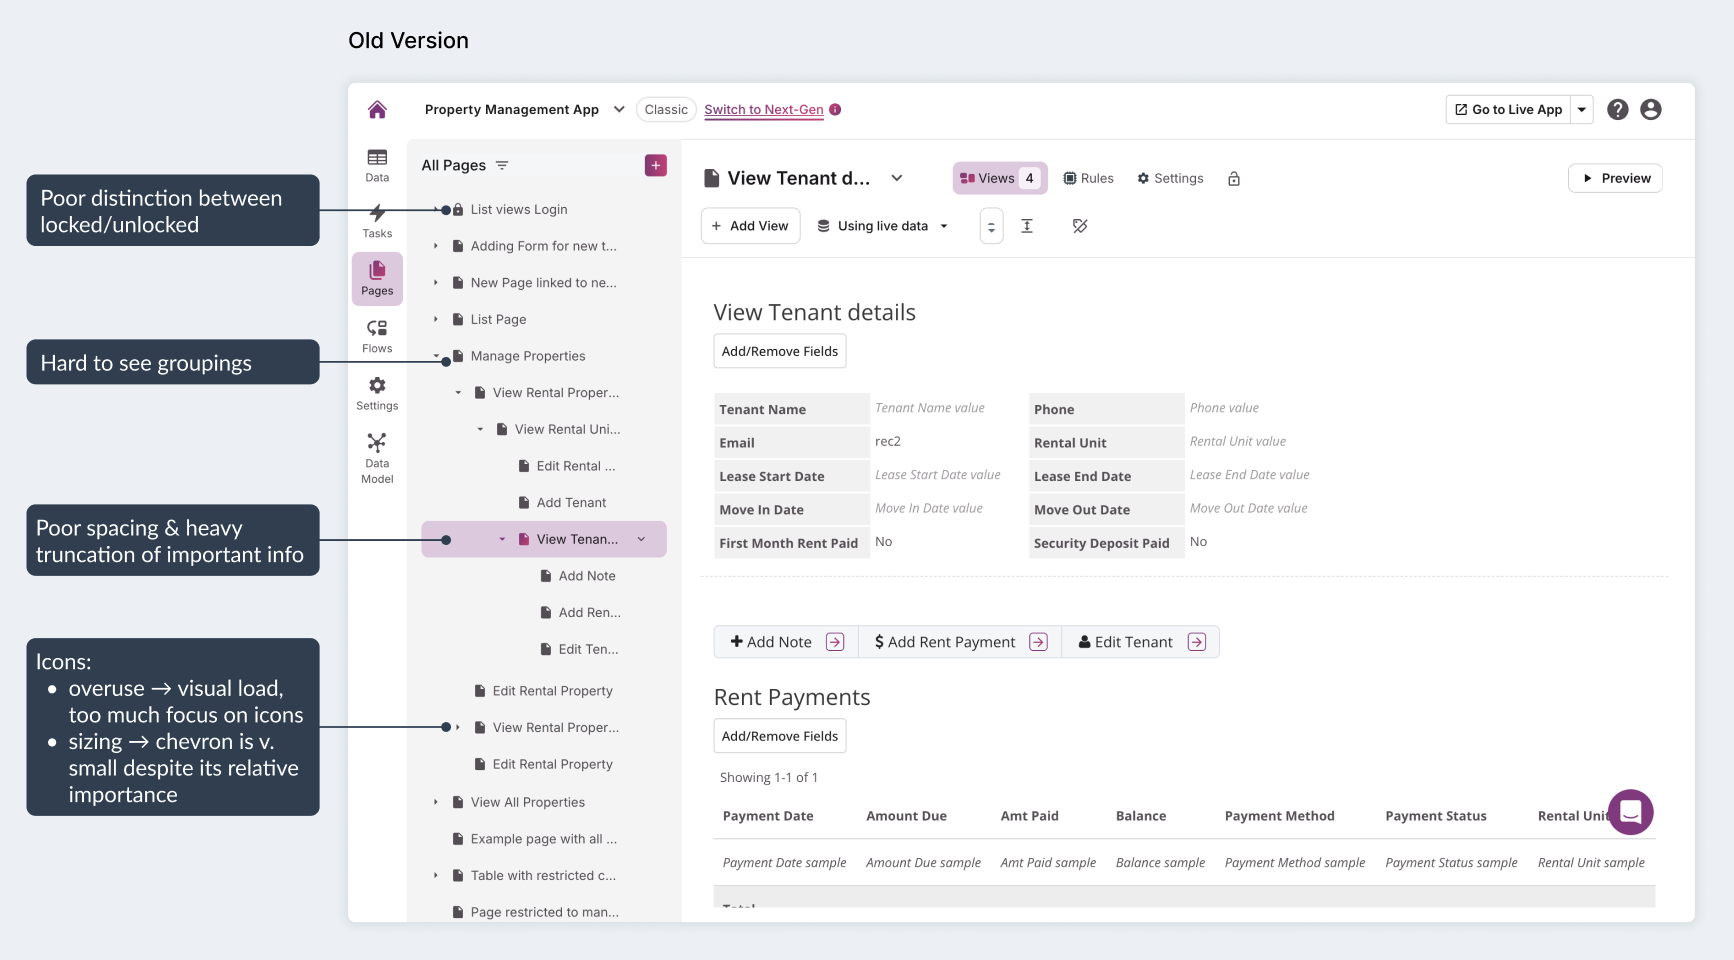
The page tree was a core focus area for improvement. The legacy design listed all pages in a single-background cascade, which became unreadable at scalewhich became unreadable at scale, with a large and overwhelming amount of information being shown at once. This was a problem because many Knack apps have a large number of pages with complex nesting.
My Role
I redesigned the page tree hierarchy and structure so each level was visually distinct, with clear affordances for expanding and collapsing groups, and a clearer distinction between page types. I tested multiple iterations with customers, focusing specifically on whether they could locate pages quickly and understand their app's structure at a glance.
Problems to Solve
Particularly in larger apps, the page tree had multiple levels of nesting, which made it hard to read and difficult to manage — drag and drop especially.
It was also missing some fairly basic features: there was no way to search pages, or to expand and collapse groups all at once.
The distinction between public pages and those behind a login wasn't clear enough either, particularly once pages were nested inside groups.
Approach
I refactored the UI based on established tree-navigation patterns, then tested different versions both internally, with CS and engineers, and externally with partners. I ran accessibility checks throughout, and the result fed into an updated pattern in the design system.
Challenges
The main challenge was that the tree "lines" that connected nested items were time-consuming for engineers to implement. However these were a key part of letting users see the structure at a glance, so we kept them in scope. The other ongoing challenge was just the sheer number of pages some apps have, which meant the design needed to hold up at that scale, not just look good in a simple example.
Design & Outcome
After research and several rounds of testing and iterations, I designed a solution that solved the key problems of the legacy page tree. Key design features/decisions included:
- Keeping the UI uncluttered by only showing information when relevant: this included showing the page options only on hover/selection, replacing the icon indicating whether the page was public or behind a login, rather than showing this along with all the other information in the resting state.
- Using locked/unlocked icons to indicate which pages are public and which are behind a login. This helped users see at a glance the access set for each page, and helped give peace of mind that content was protected by a login when needed.
- Adding a pattern to groups of pages behind a login via a dot on pages nested below a protected parent more clearly showed pages that inherited parent page restrictions.
- A general search on the pages side panel meant users no longer had to scroll through a long page list, or remember how they had structured their pages, in order to find and select a page to edit it.
- Animating the panel header to minimise down to an icon-only state on scroll meant the actions in the header remained easily accessible but did not permanently taking up space.
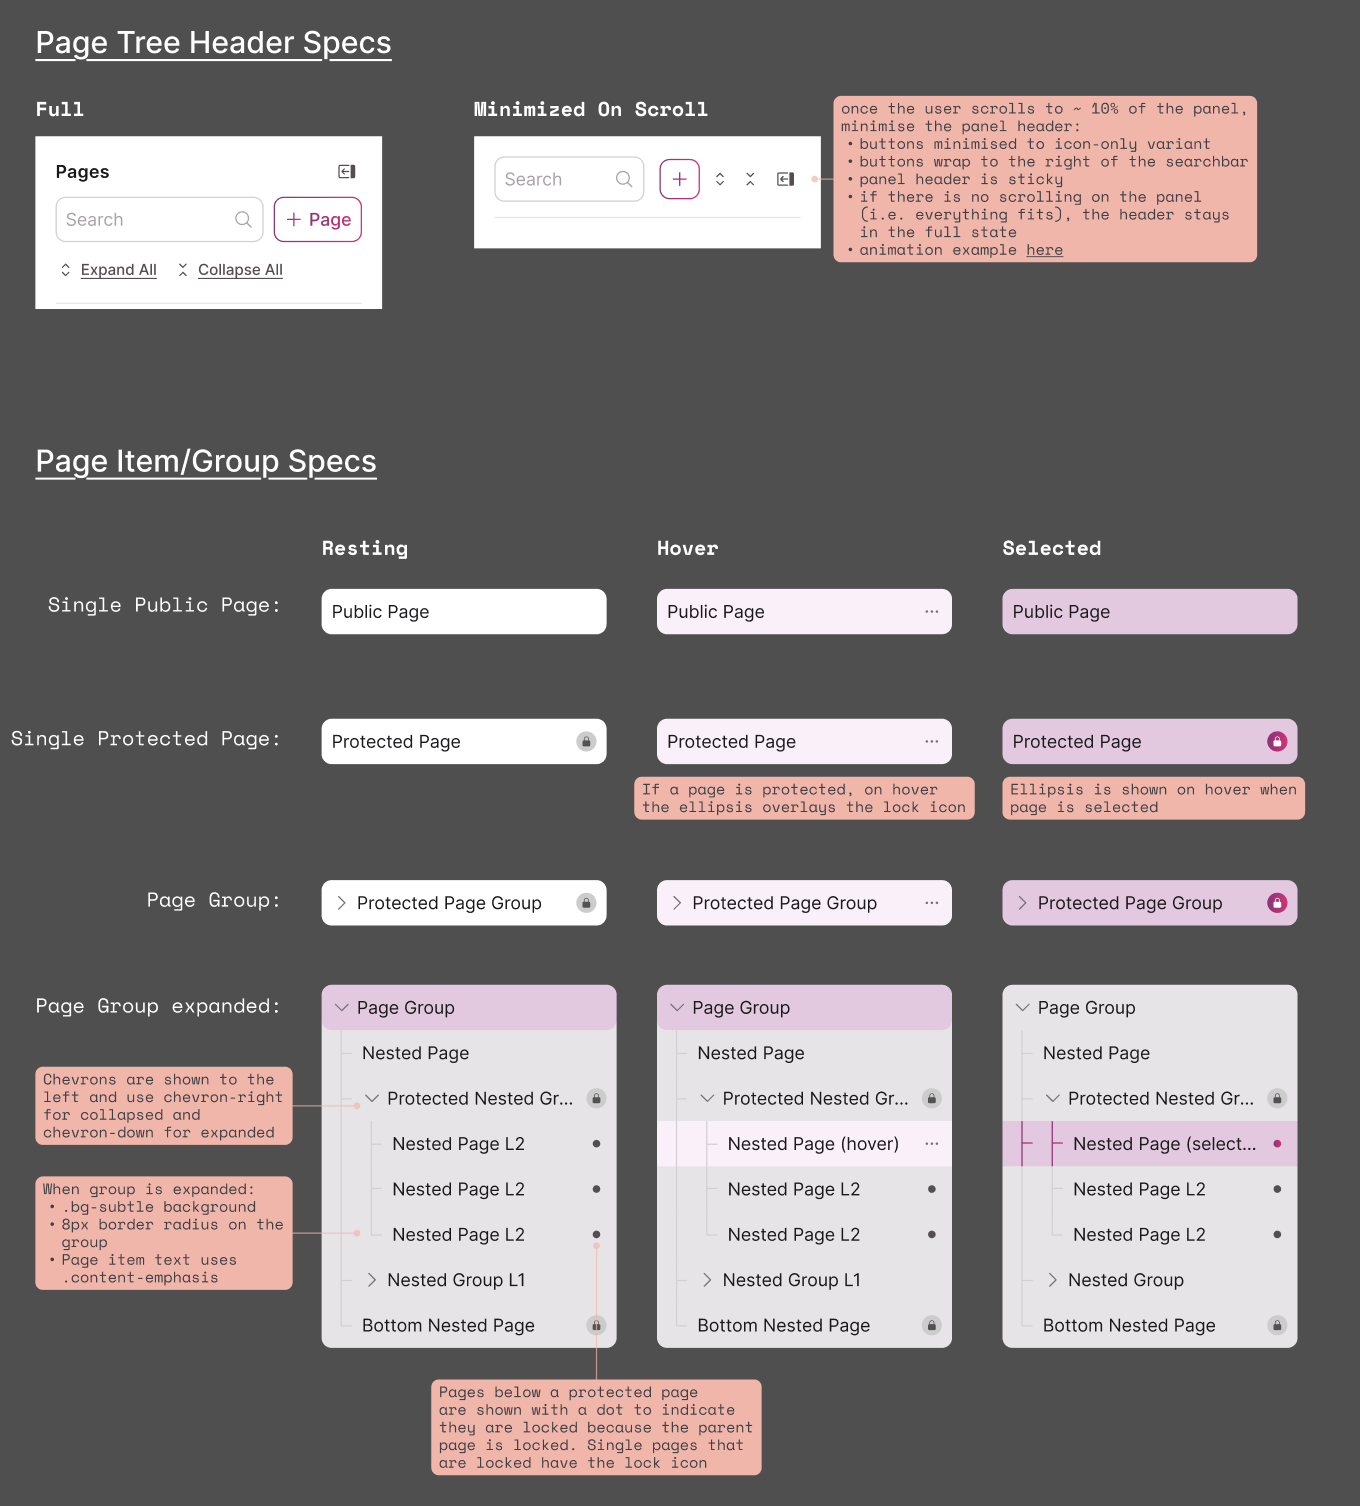
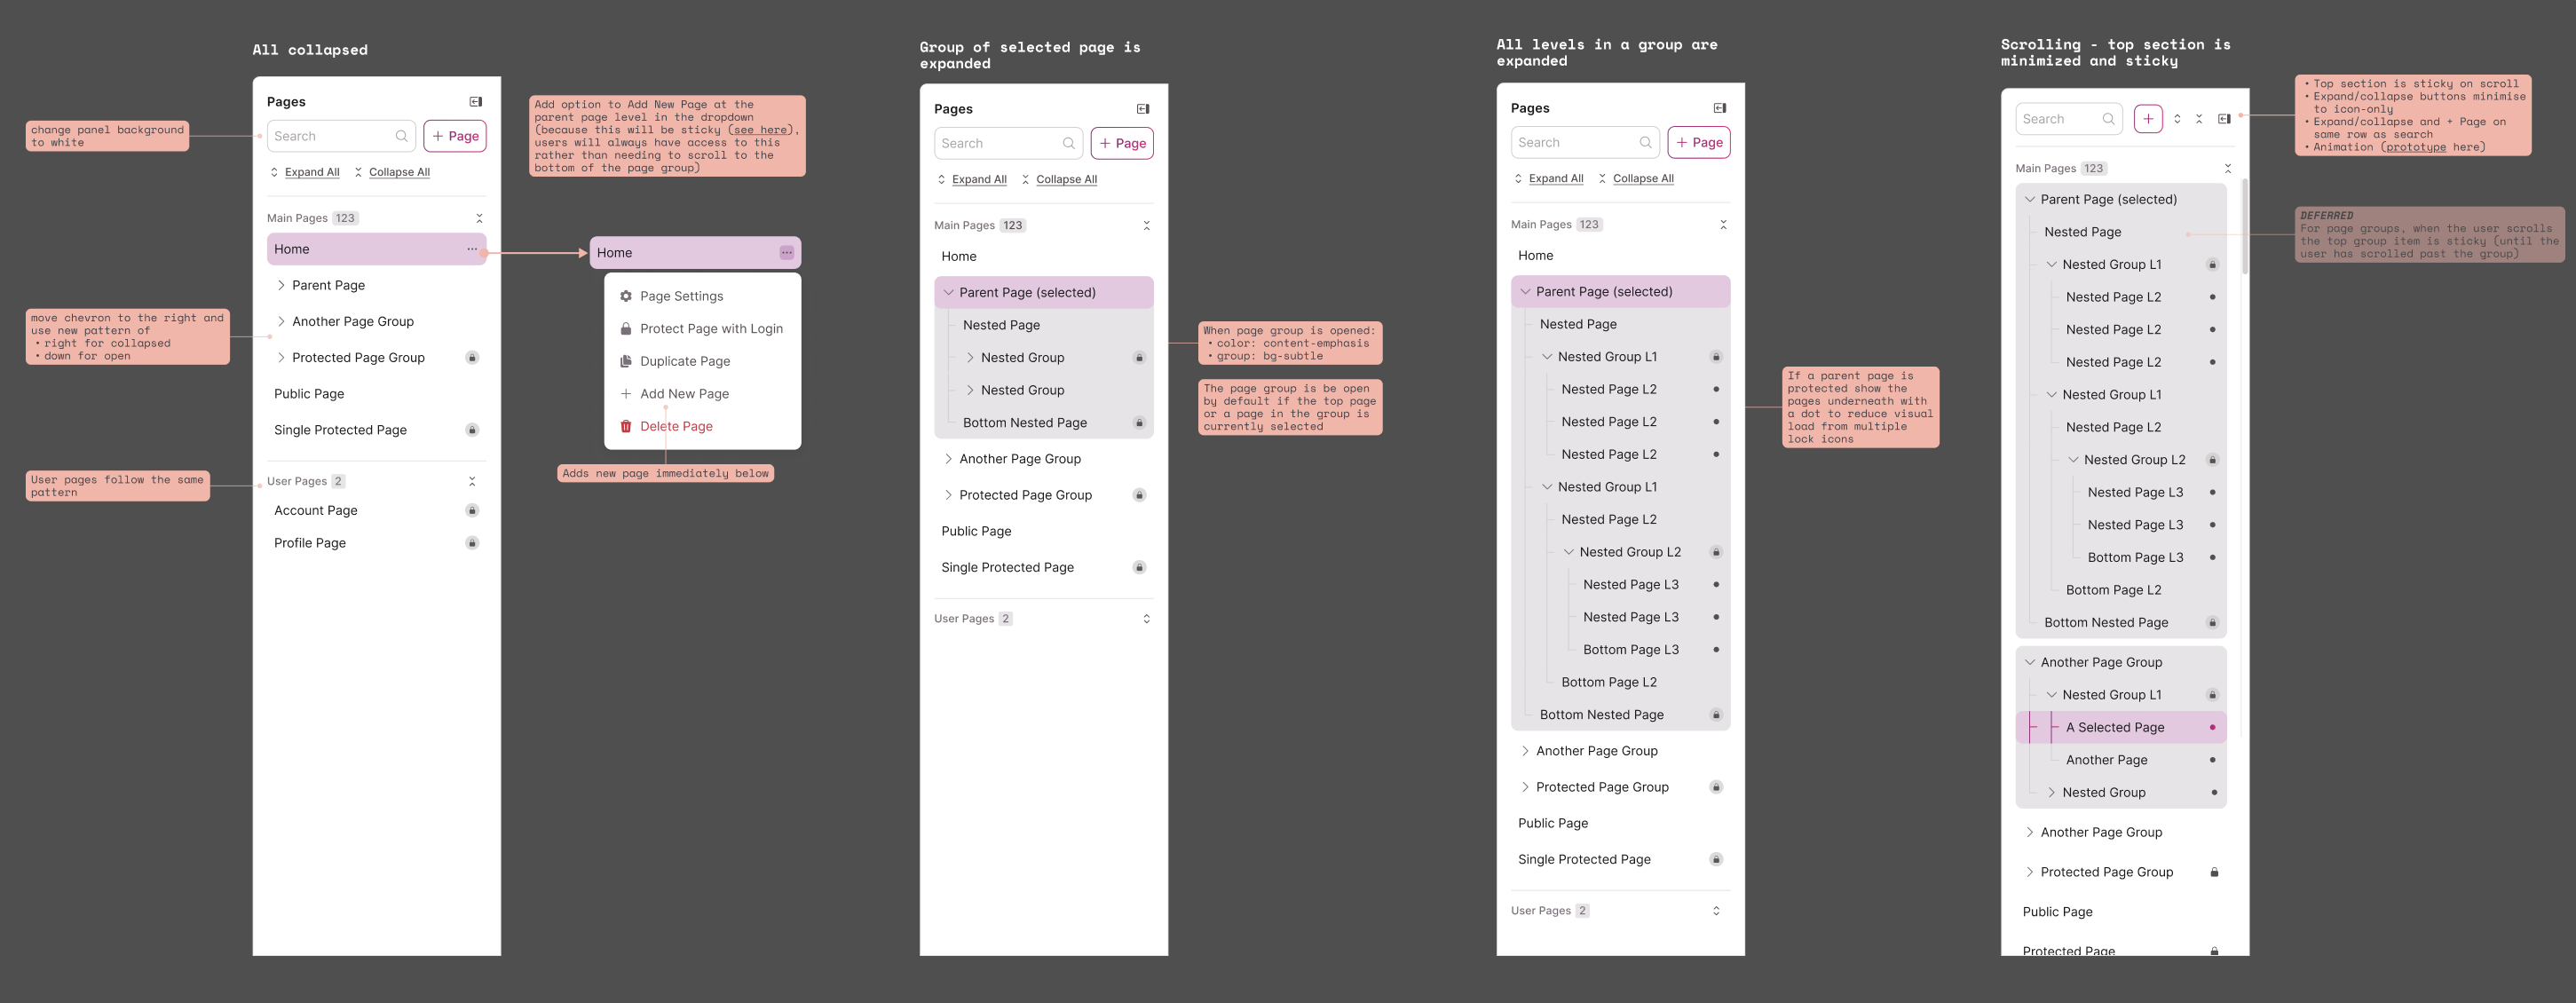
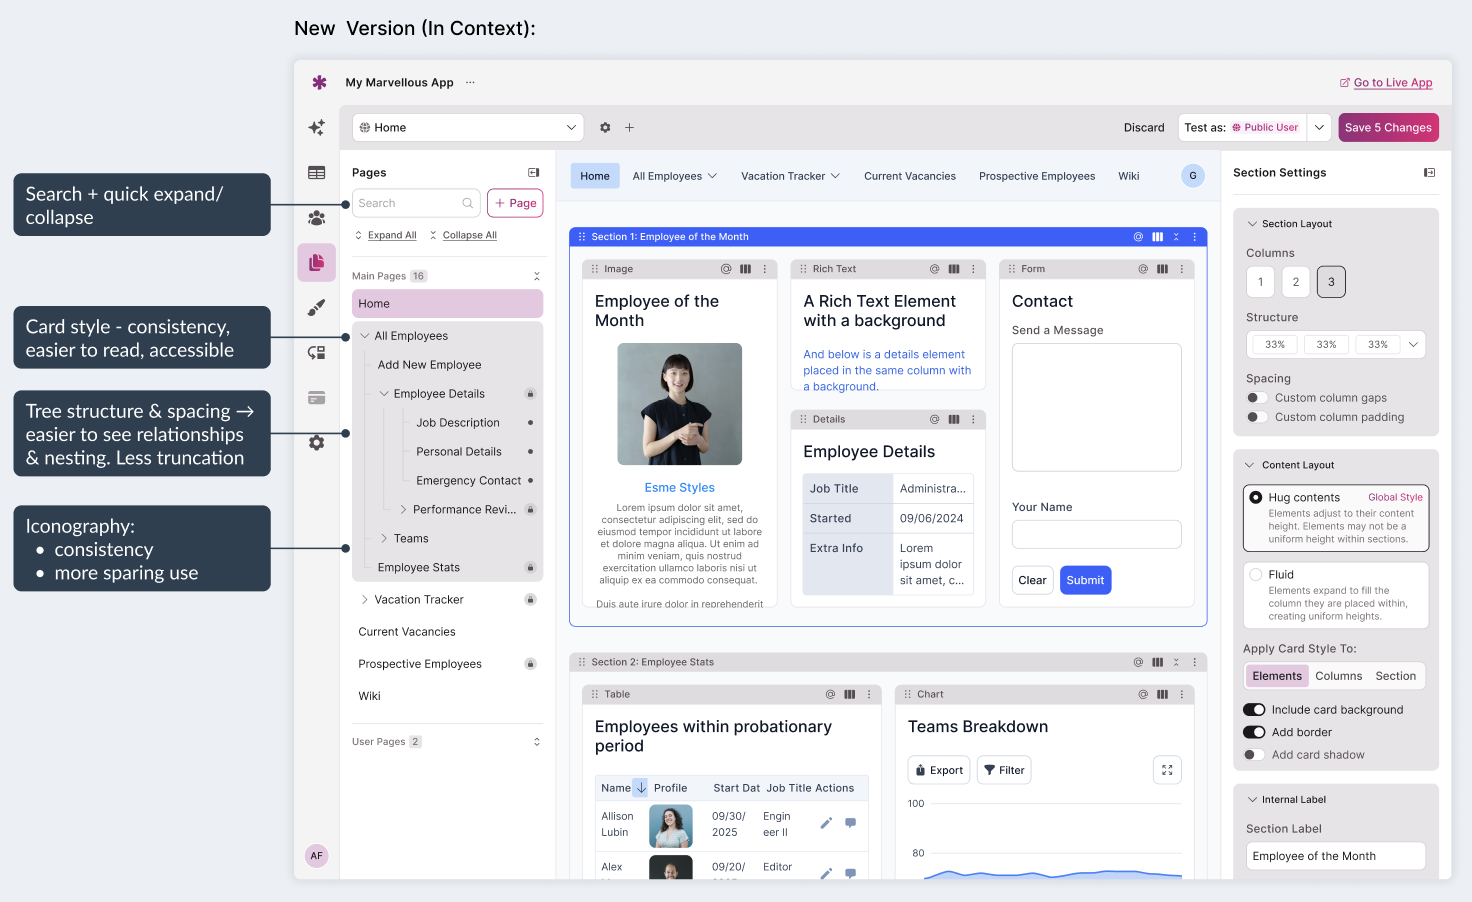
- Styling page groups as expandable/collapsible cards, with a clear background, helped with the visual differentiation of groupings.
- Adding expand/collapse-all links at the top of the panel solved a functional gap customers had flagged, by allowing users to get a full picture of their page structure without manually opening/closing every group.
- Implementing the common pattern of subtle tree lines in the nested groups helped show which level a page sat at even several levels deep, or inside a group with many pages.
The resulting page tree design was able to scale to apps with hundreds of pages without becoming unreadable. The gropuing of pages into cards was noted as being particularly helpful in terms of making the whole tree easier to scan. This also reused a pattern already established in the settings panels, so it felt familiar.
Data Visualisation: Updating Charts and Color Schemes
Background
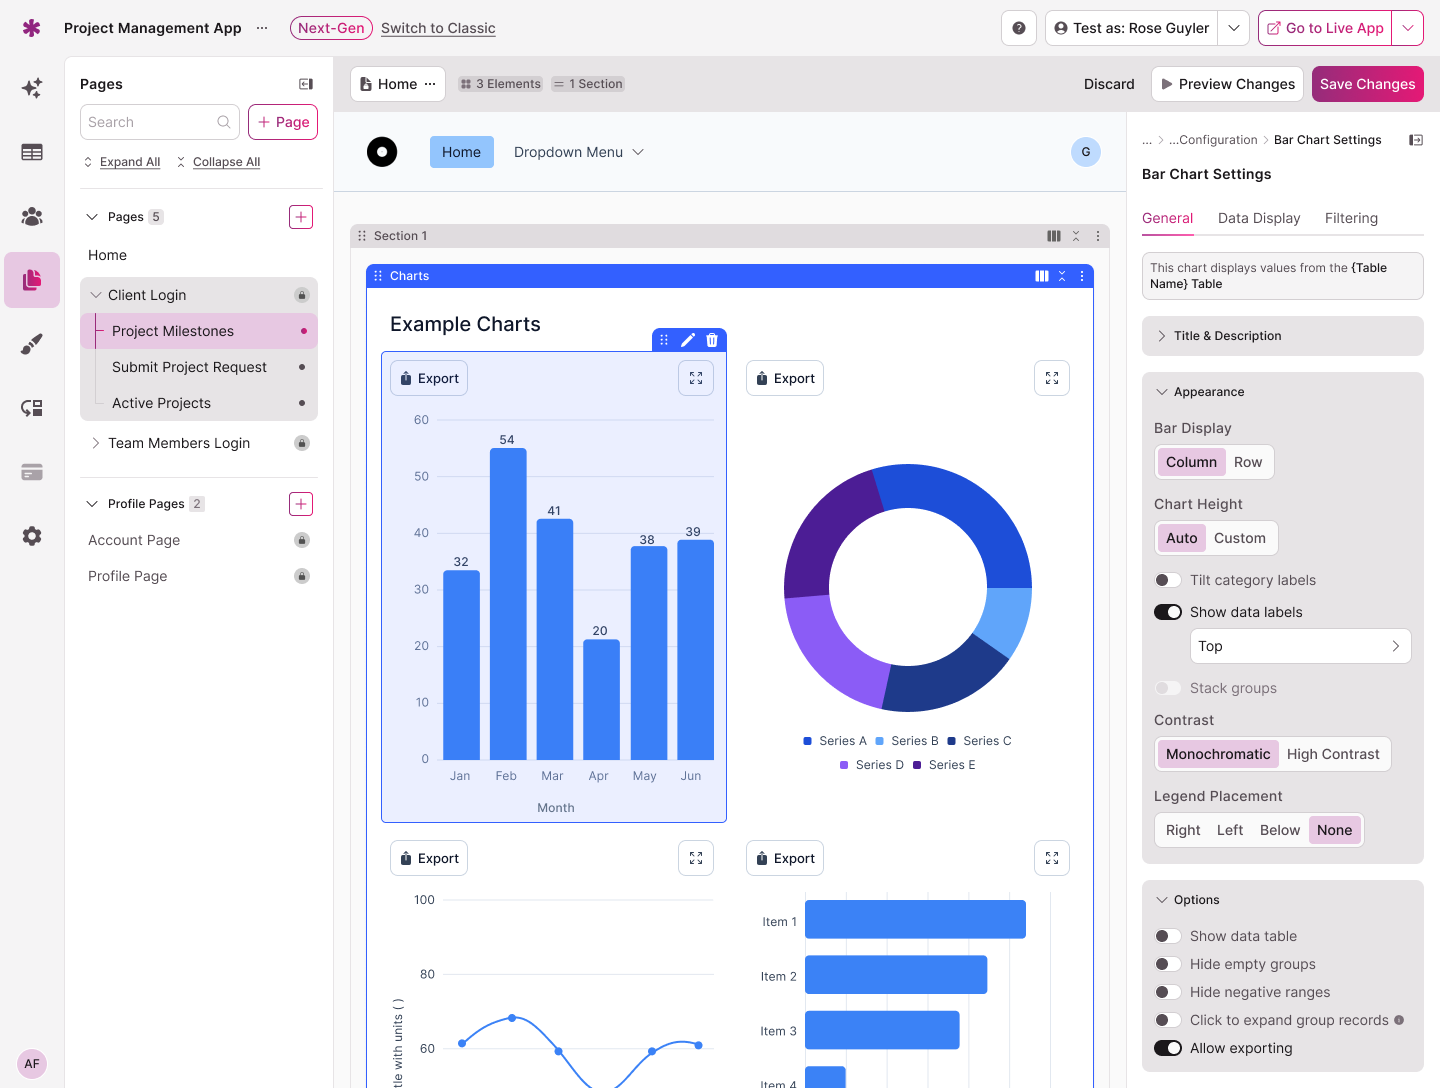
One of the problems we identified in our legacy end-user App was in the Reports element, where customers build out data visualisations. It was built on a single chart color scheme which did not meet accessibility standards, was visually outdated, and lacked the flexibility customers needed. We switched from Highcharts to Recharts to give users more customisation options, and this also gave us the opportunity to redesign the data visualisation colors and options.
My Role
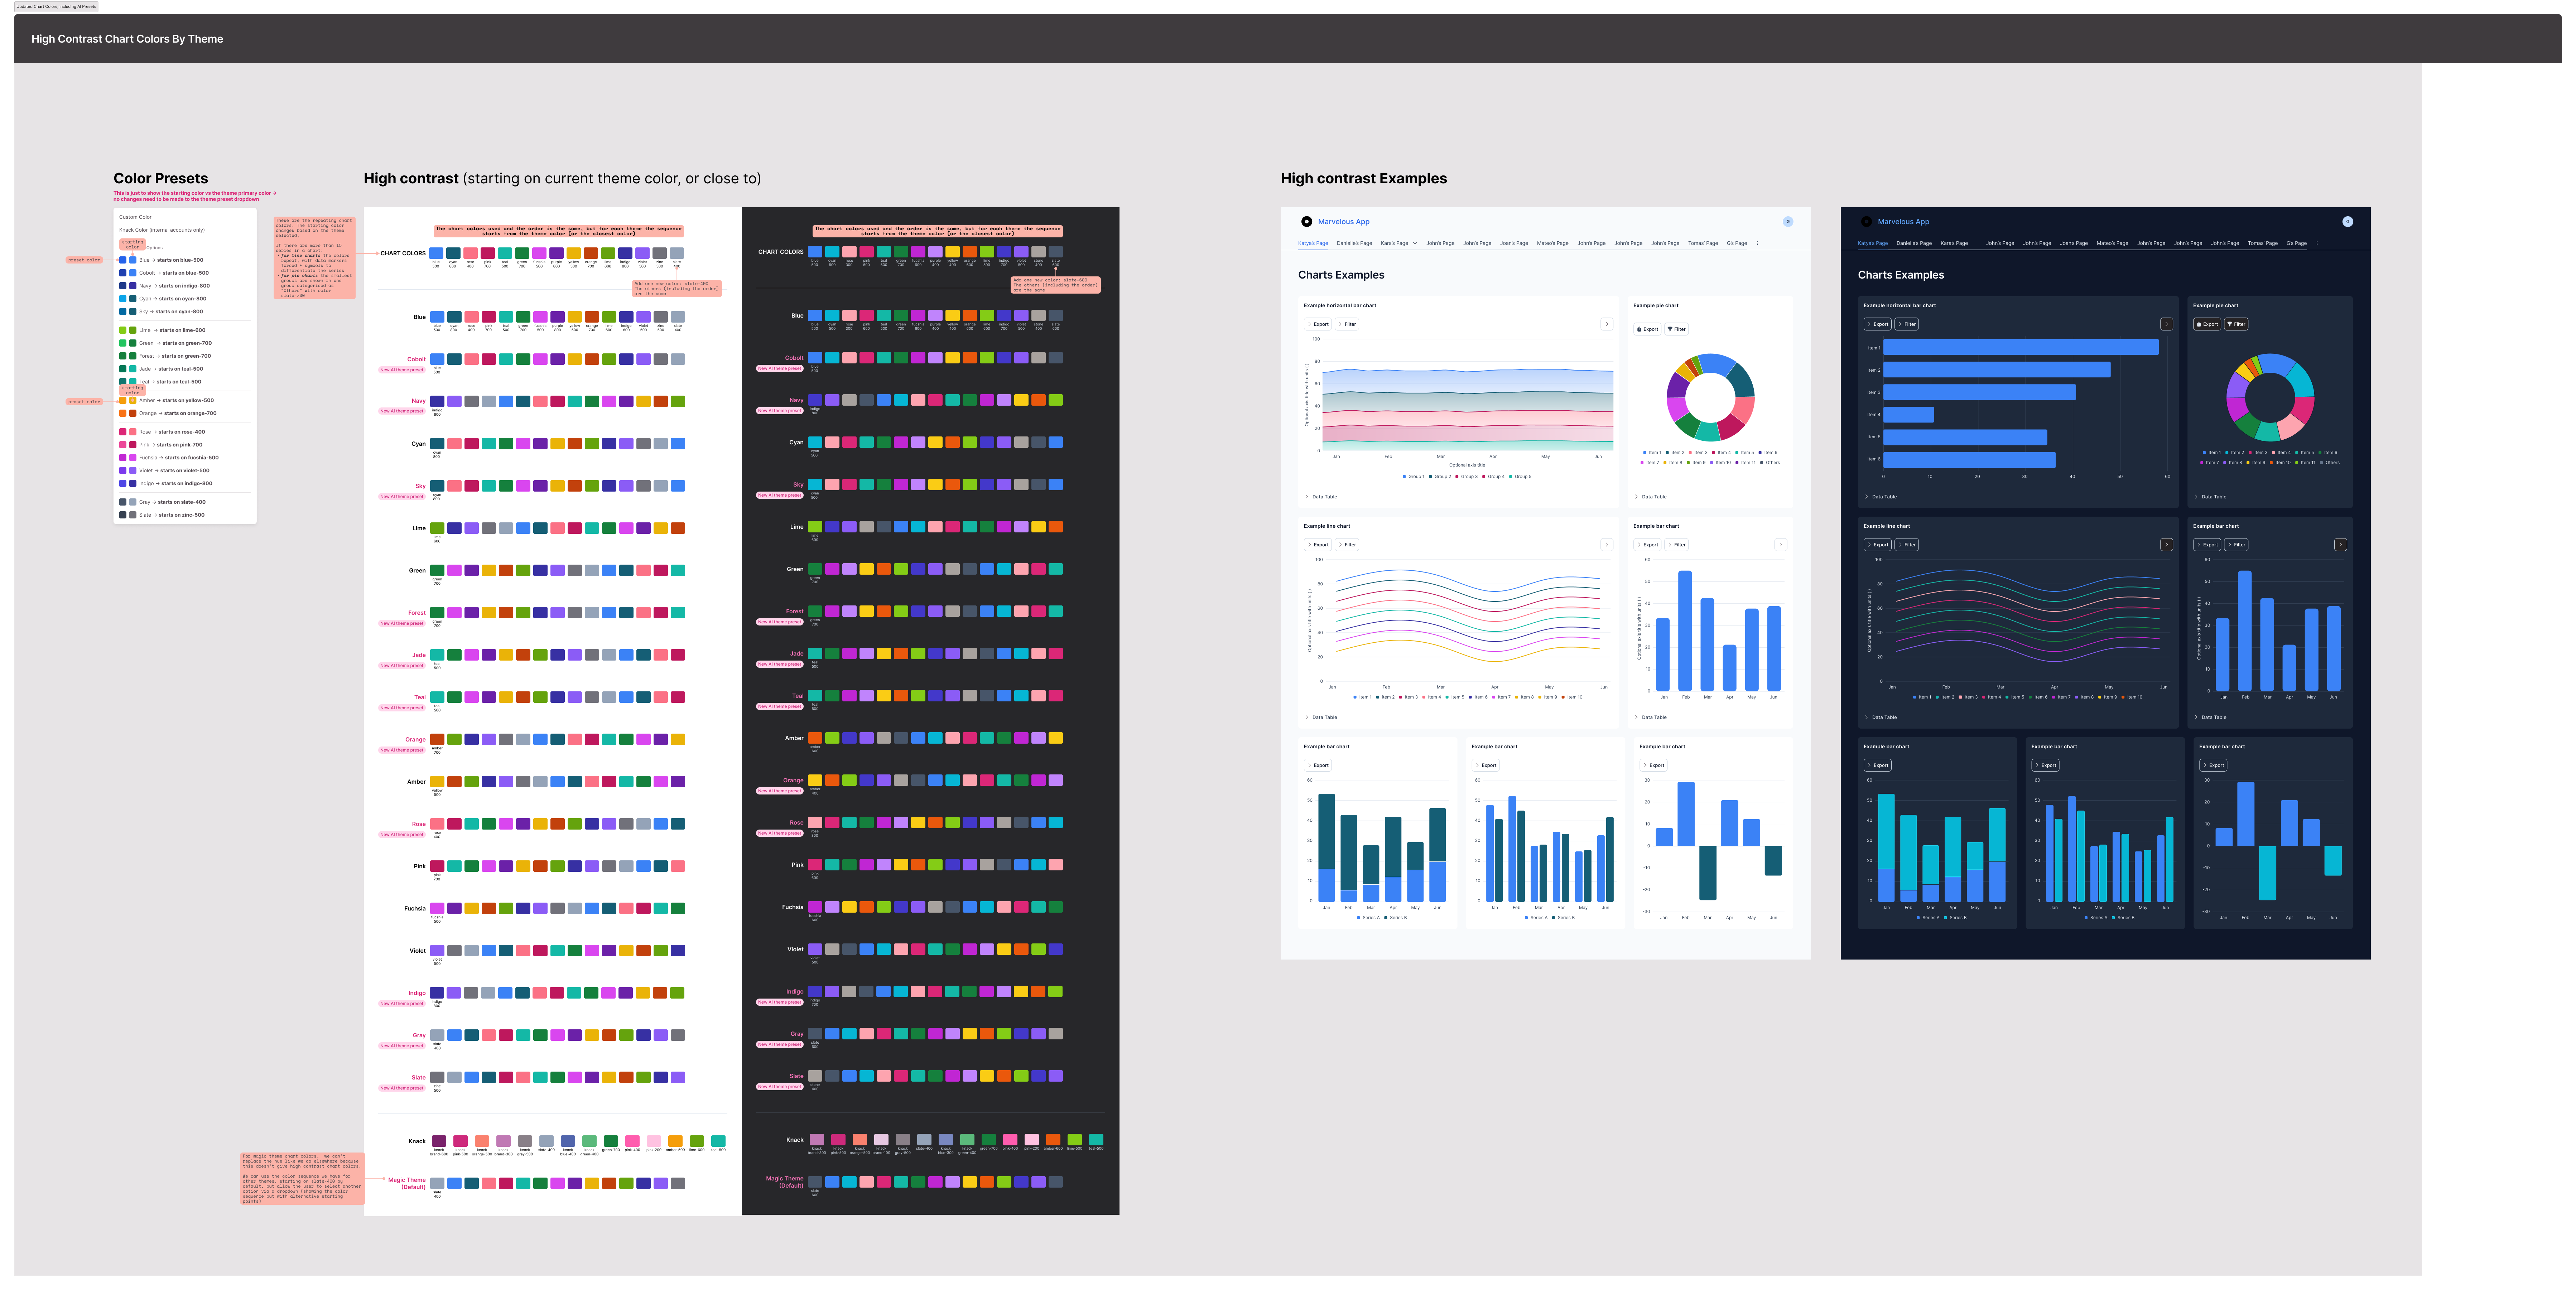
I created a new color system which could be used across all data visualisations. The challenge in this project was around Knack's theming model: customers could set an app-level theme from a set of presets, or define a fully custom one. The chart color palettes and color system needed to work across any of those preset themes, and also apply across light and dark mode.
I led the full design which covered creating the color system, defining how the presets would work, and the rules for applying the color system to the presets.
The Approach
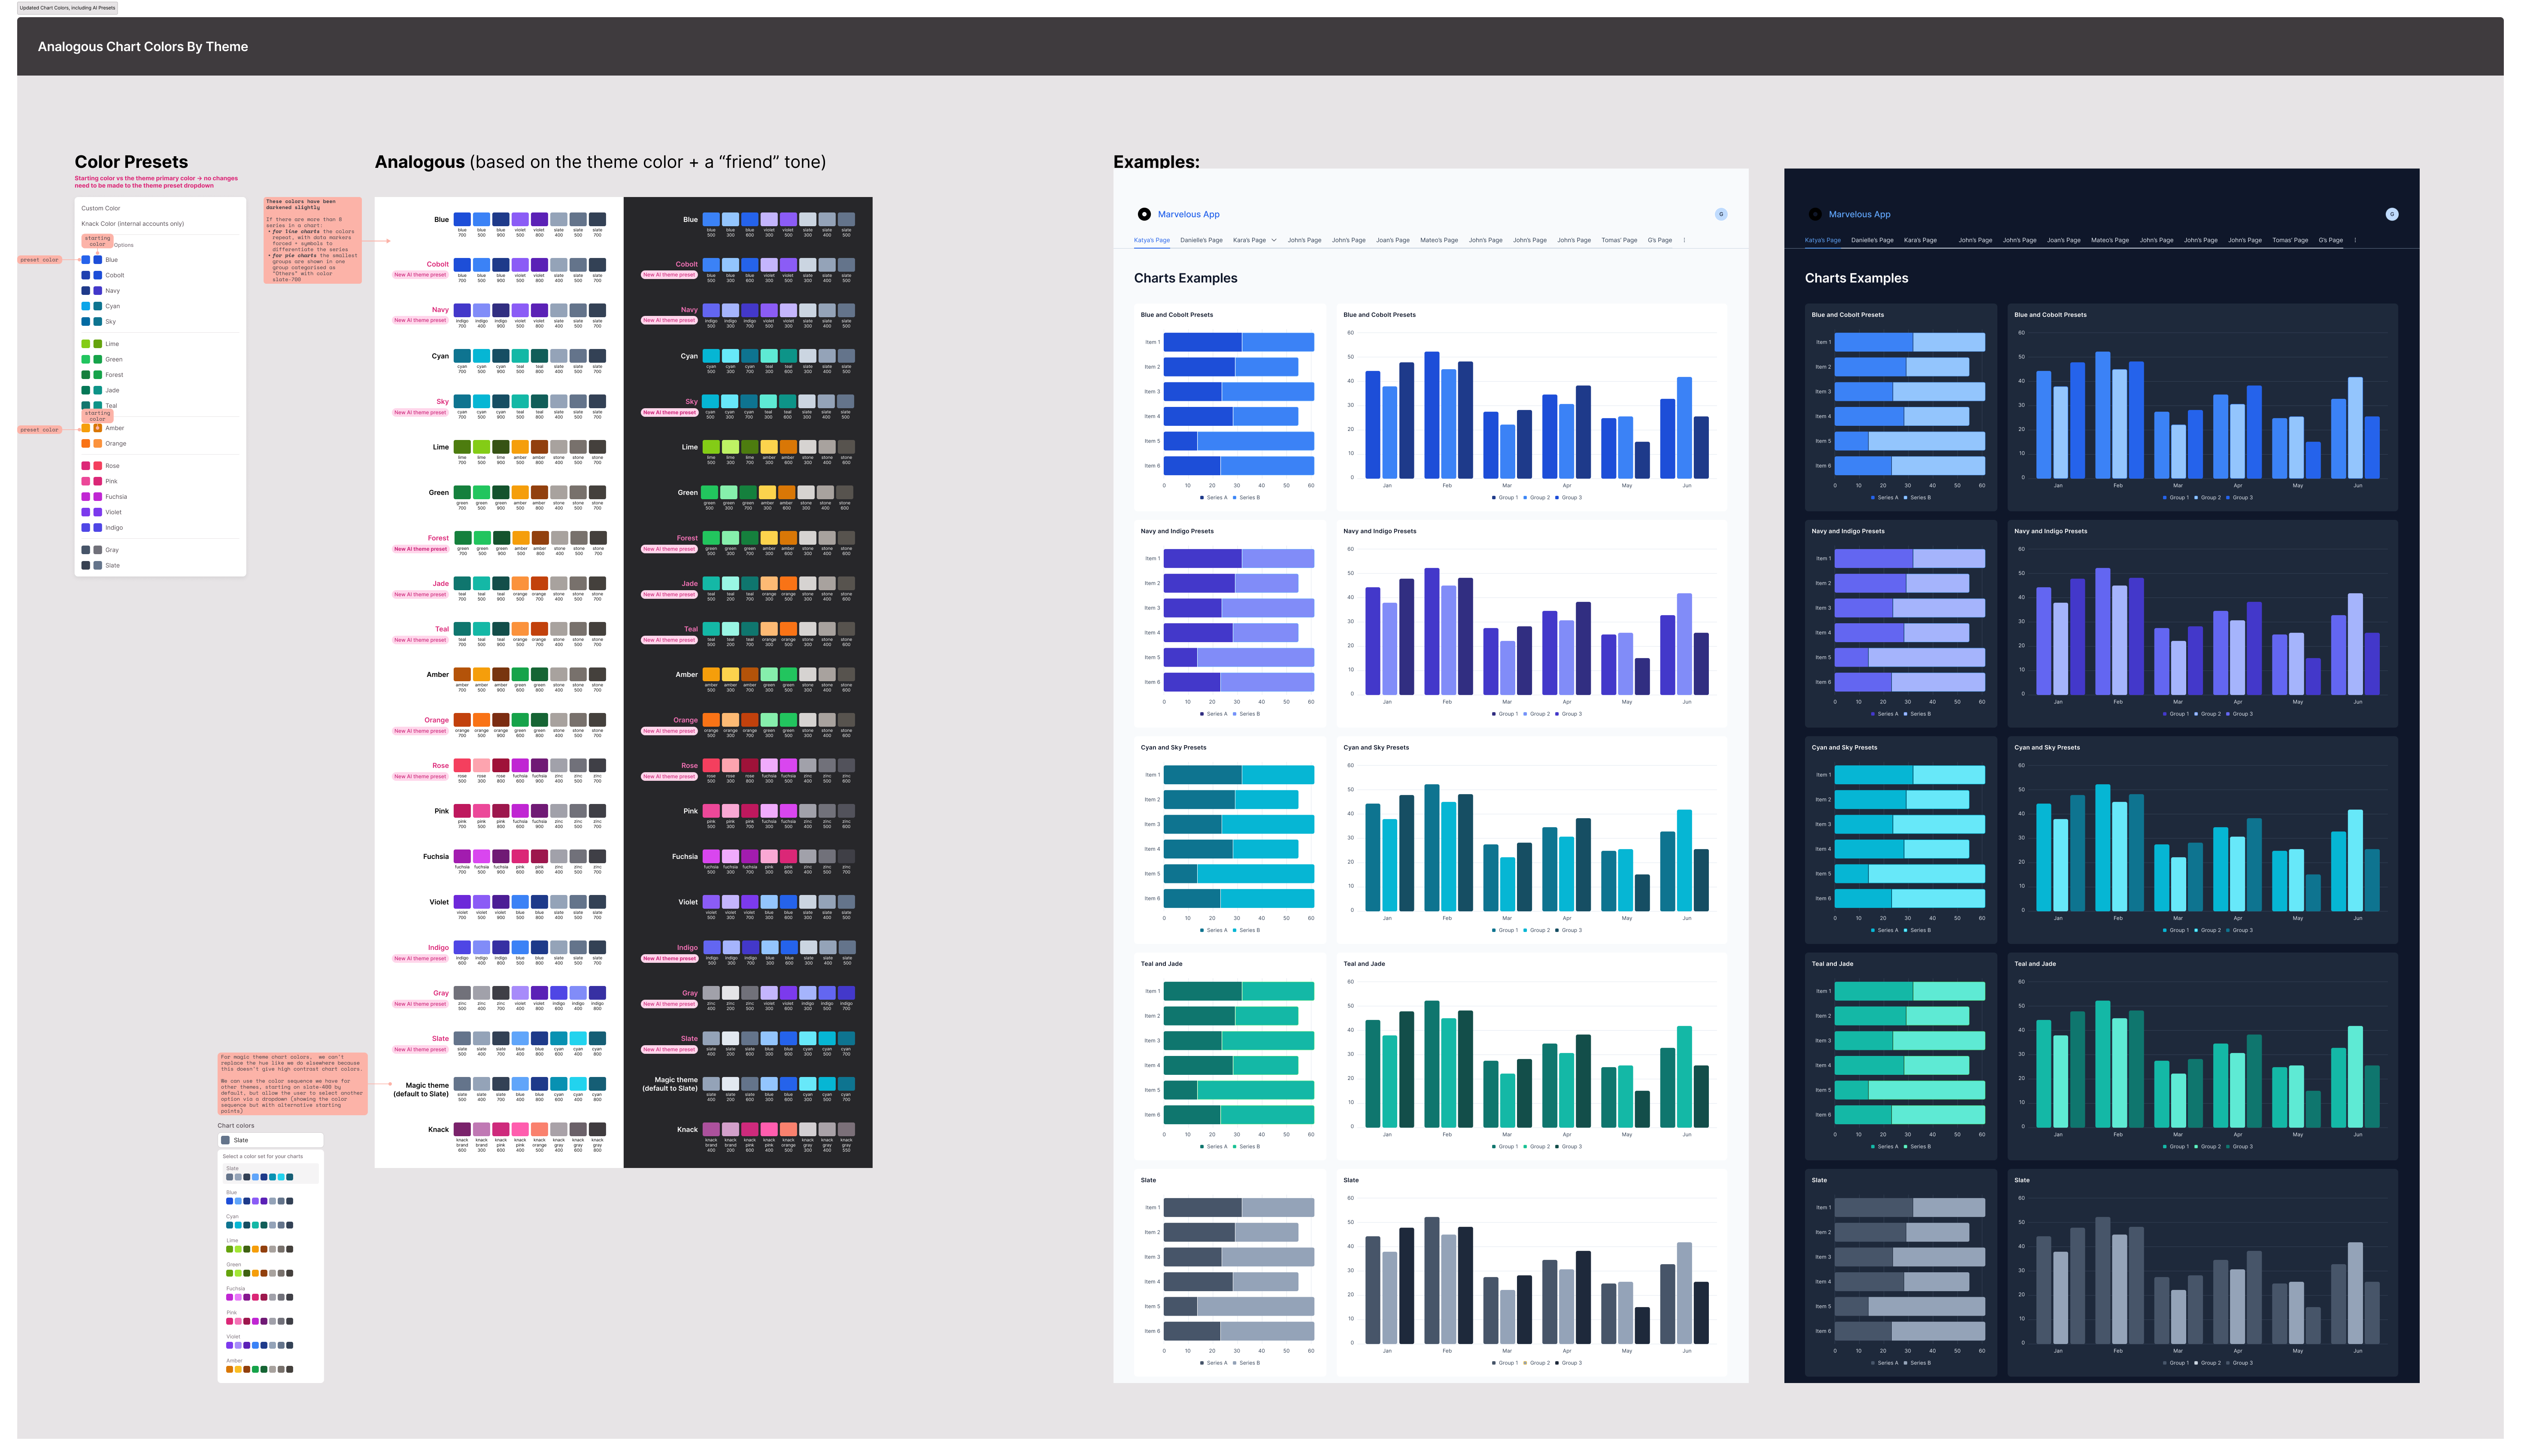
Rather than picking a single default palette, I designed a set of schemes and rules that would result in visually coherent, accessible charts across any theme a customer might pick.
A key consideration when defining the color system came from thinking about the data in each chart type and the need for different color rules depening on how groups of data/series related to one another. Data series that relate to each other (i.e. different segments within the same category) are better shown in monochromatic or analogous colors, which signal that the points belong together. Data series that aren't related (i.e. distinct data points in unrelated categories) benefit from higher contrast, more visually distinct colors.
The default setting (analogous or high contrast) would be automatically selected based on the chart type the user was adding to their app, but they would always have the option to switch to the other setting if desired. This would allow the user to always have accessible chart color options (the high contrast setting) if required, but it would also prevent the charts from becoming visually overwhelming via the use of the analogous color scheme when appropriate.
The next step was to ensure a way for the colors to be appropriate to the user's selected overall app theme. We were using Tailwind colors for the themes, so I devised a color sequence using Tailwind for both analogous and high-contrast color presets. The color sequence included colors from each color palette in the themes pre-sets, so the starting point in the sequence could simply be the corresponding theme color and the colors would then cycle through the rest of the sequence from there. This way, charts would visually match the user's selected theme and feel on-brand.
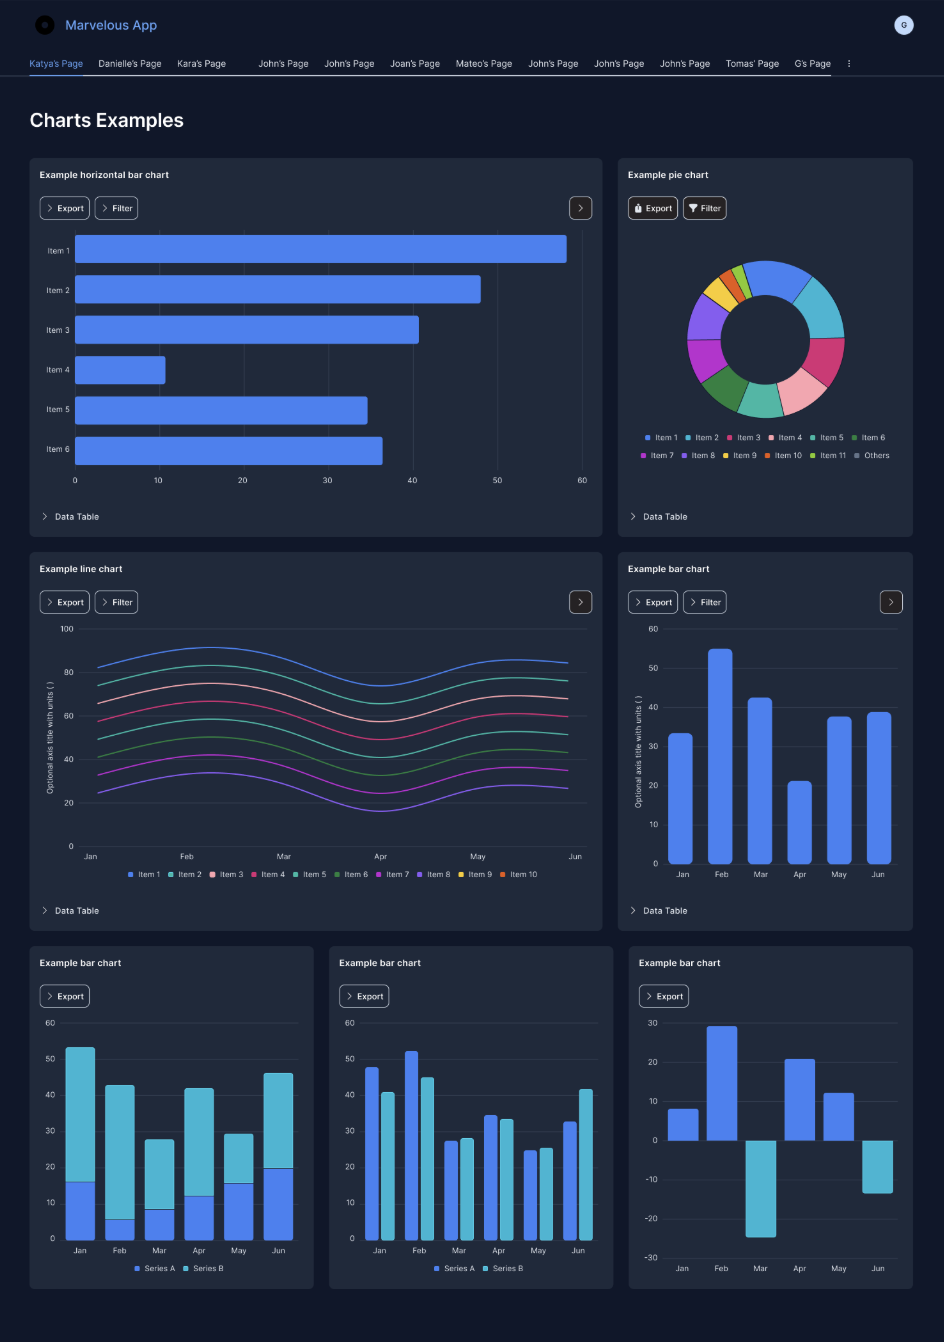
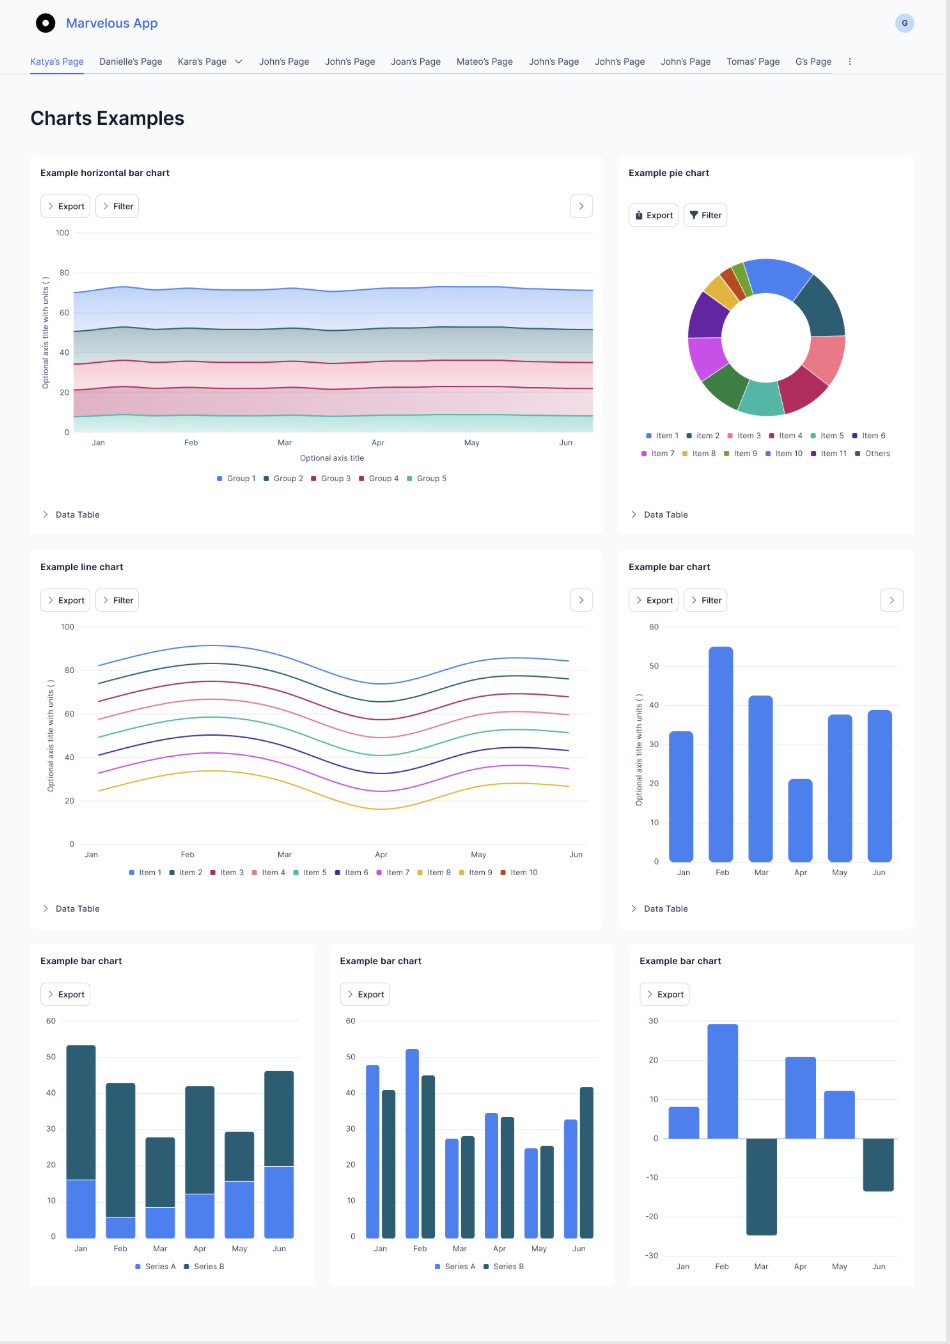
Every palette was checked against W3C accessibility contrast requirements, for both light and dark themes.
Handling Custom Themes
Most use cases were covered by the sequencing pattern I had defined, however, app-level Themes allowed customers to choose a completely custom color as their primary color which would then apply that hue (with luminosity calculations built in to ensure accessibility) to all other colors in the app. In these cases, the user can select from a set of options for the analogous colors to choose the closest to their chosen theme. We decided to start with this simple approach and build on it later if we hear from customers that they want to be able to create their own custom chart color scheme.
What's Next
The main feedback we have received has been around setting specific colors per series within charts, for example fixing Series B to always be blue across every chart in the app. We already have chart-level display rules which allow the series color to be fixed per chart, but there's a clear need to alow users to set this up once at the app level, to make the configuration easier and ensure consistency.